Cryptocurrencies

What Is Crypto?

An important question for investors to consider is why they would want to possibly own cryptocurrencies. The question is basically, “what is crypto?” which means is it a hedge against disaster, a speculation, a means of exchange or something else.

Economists at the New York Federal Reserve recently addressed this question, specifically seeking to determine what motivates people to participate in this market.

To find out, the economists included a special set of questions in the May 2018 Survey of Consumer Expectations, a project of the New York Fed’s Center for Microeconomic Data. The survey covers a sample of 1,146 people from ages eighteen to ninety-six, with broad representation by race and gender.

Cryptocurrency Ownership and Demographics 

Eighty-five percent of the survey’s respondents had heard of cryptocurrencies. Around 5 percent of respondents reported that they currently or previously owned cryptocurrency and an additional 15 percent reported that they were considering buying cryptocurrency. 

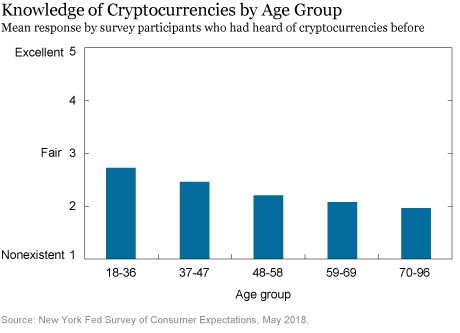
Actual and potential ownership of cryptocurrencies is concentrated in younger, wealthier demographics. Anecdotal evidence suggests that enthusiasm for cryptocurrency is highest among younger generations.

Consistent with that pattern, the economists found that individuals between 18 and 35 were 13 percent more likely than those over 35 to own or express an interest inbuying a cryptocurrency. Not surprisingly, the young group were more likely, on average, to report greater knowledge about cryptocurrencies, as shown in the chart below. 

knowledge of crypto by ageSource: Federal Reserve Bank of New York

Older individuals were much more likely to cite “not knowing how to buy” cryptocurrencies as a reason for not owning any. This suggests that a lack of knowledge or familiarity with the cryptocurrency market could be an important barrier to entry for older demographics. 

Individuals with an annual income of at least $100,000 are 5 percent more likely to own or express an interest in buying cryptocurrency relative to those with income of less than $100,000.

That means that younger individuals were significantly more likely to report “lack of funds” as a reason to not buy. This suggests that financial constraints may have hindered otherwise enthusiastic members of the younger demographic from participating in cryptocurrency markets. 

Cryptocurrency Is Like…?

To understand people’s views on cryptocurrency, the economists also asked survey respondents what they perceived cryptocurrency to be most similar to, given the following options (multiple answers were allowed, with the exception of “none of the above”): 

  • Gold
  • Traditional money, such as U.S. dollars
  • A new technology
  • Stocks or bonds
  • A lottery ticket
  • None of the above

The dominant view was that cryptocurrency is most similar to “a new technology,” with 47 percent of respondent choosing that option. About 24 percent likened cryptocurrency to stocks or bonds, and 17 percent likened it to traditional money. Only 8 percent viewed cryptocurrency as similar to gold. 

But, those results might be hiding important information about the market.

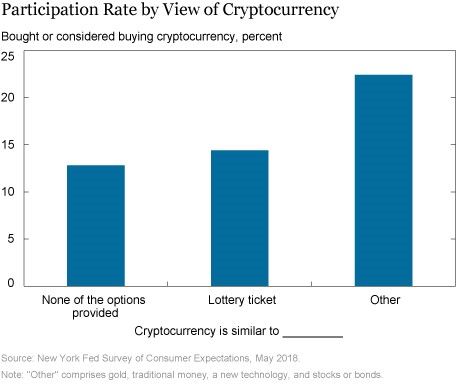
Individuals who owned cryptocurrency or were interested in buying it were particularly likely to perceive cryptocurrency as being similar to gold (41 percent) and stocks or bonds (39 percent). This suggests that such individuals may think of cryptocurrencies as an investment vehicle.

In addition, 37 percent of respondents within this group likened cryptocurrency to traditional money.

If we think of traditional money as a means of payment, then this distribution of views is consistent with the idea that cryptocurrencies are currently perceived less as a payments mechanism than as an investment, even if they can play both roles. 

By contrast, individuals who viewed cryptocurrency as being akin to a lottery ticket were 12 percent less likely to have owned or considered buying a cryptocurrency than those who viewed cryptocurrency as being similar to one of the other choices.

The gap between the latter group and those who responded “none of the above” was 11 percent, as shown in the chart below. 

crypto participation rate

Source: Federal Reserve Bank of New York

Motives for Owning a Cryptocurrency

The economists also asked survey participants to identify the most important reasons for buying cryptocurrencies, or choosing not to. The most-cited reason for buying was that cryptocurrencies are a “good investment.”

Many buyers also pointed to the anonymity properties of cryptocurrency and their lack of trust in the existing financial system—factors that were mentioned almost the same number of times.

Convenience was not viewed as a reason to buy, perhaps because the majority of cryptocurrencies struggle to be a stable means of payment owing to price volatility, and the fact that cryptocurrencies are not accepted broadly as a means of payment. 

Among respondents who chose not to participate in the cryptocurrency market, the most-cited reason was that cryptocurrencies are a “bad investment”—the opposite of the prevailing view among buyers.

This dichotomy could reflect the speculative nature of cryptocurrency markets and suggests that there are large disagreements between respondent groups about the investment value of cryptocurrencies. 

“Lack of trust” ranked second as a reason not to buy cryptocurrencies, perhaps reflecting their lack of institutional backing. Again, the “buyer” and “nonbuyer” camps are clearly divided on this matter; the former lack trust in the financial system, while the latter lack trust in cryptocurrencies.

Respondents cited a lack of need as the third most significant reason for not buying cryptocurrency, consistent with the fact that cryptocurrencies are little used as a means of payment. 

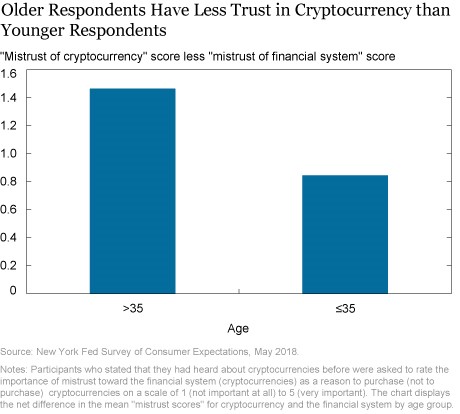
The issue of trust, or mistrust, appears to be perceived quite differently by the young and old groups. Individuals over thirty-five were much more likely to express distrust of cryptocurrencies relative to the existing financial system. 

older respondents vs. cryptoSource: Federal Reserve Bank of New York

The young group’s more sanguine view of cryptocurrencies could be related to the fact that financial crises appear to have long-lasting “experience effects” that take a greater toll on younger individuals than older ones, both psychologically and financially.

In the wake of the Great Recession, younger cohorts may have less faith in the financial system and more openness to unconventional alternatives. 

To Sum Up

The survey reveals that a very high fraction of respondents are aware of cryptocurrencies and that they hold a wide variety of views on the topic. This is perhaps related to the fact that cryptocurrencies are still a relatively new phenomenon.

As with many new things, younger respondents seem to have a more positive view of cryptocurrencies than their older counterparts. As the technology matures and new applications for cryptocurrencies emerge, it will be interesting to find out how these views change. 

For investors, it all indicates that the future of cryptos could be bullish since demographics seem to favor the technology.


Stock market

Uber, Lyft and Pinterest Could Be Signaling Investors

CNBC is warning that “Euphoric IPO market may be a troubling sign for stocks” and the article notes,

“Billion-dollar private companies are stampeding to go public this spring. But fear, not excitement, may be driving the herd.

After a slow first quarter for public offerings, denim giant Levi Strauss kicked off its debut [in March] with shares popping 31 percent on the New York Stock Exchange.”

The stock did not hold its gains after trading began.

stock gains chart

Source: Yahoo

CNBC continued, “The ride-hailing service Lyft is next up to bat and is expected to hit a $23 billion valuation when it lists on the Nasdaq next week. The social media app Pinterest has moved up its timeline to list, filing its IPO prospectus with the SEC on Friday.

Uber, with a jaw-dropping $120 billion target valuation, is planning to release its filing and kick off an IPO roadshow in April, according to Reuters. Slack and Palantir are also on deck in 2019.

But a re-energized, euphoric IPO market is not necessarily a bullish sign, according to some industry experts. It could indicate private investors in these companies want to cash in their chips.

This month’s excitement traces back to the end of last year. A lot of these companies could have listed in the second half of 2018 but put it off. Then came December, the worst month for stocks since the Great Depression.

Larry McDonald, managing director of ACG Analytics, said Silicon Valley clients he has spoken with behind the scenes regretted not listing before the December dip.

“They should have done these deals all last year, and they put it off,” said McDonald, who is also the editor of the Bear Traps Report. “The beatings that these guys took for not bringing those deals in the third quarter were substantial.”

Beatings mostly took the form of criticism on their risk management, McDonald said. But luckily for the start-ups, comments from the Federal Reserve have saved the day.

The Fed has suggested no rate increases would come this year — after indicating in December that two could take place. The newest stance sent stocks higher, providing a solid backdrop for these companies to now go public.

Many private equity and venture capital investors are now “panicked to just get out,” McDonald said.

Today’s IPOs are essentially, a “very bright private equity crowd desperately hitting a fleeting late cycle bid after missing that bid in Q4 and looking down the barrel of a 20 percent U.S. equity market drawdown,” McDonald said.

Larry Haverty, managing director at LJH Investment Advisors said the first-quarter rush to go public is “greed more than fear.”

“That will keep happening until the lights are turned off,” Haverty told CNBC in a phone interview. “IPO booms almost never end well.”

Based on the over-subscription of Lyft’s IPO and successful Levi’s entry, he said investment bankers are likely looking to rush these deals out the door. Bankers are likely telling clients, “the window is open but this Lyft and Levi Strauss is a period of insanity and we better get in on this.”

“It’s finance 101 — make hay while the sun shines,” Haverty said. “If you’re a tech company looking at selling stock now, there’s no reason on God’s green Earth that you wouldn’t sell it.”

Research Backs the Analysts

In “Using IPOs to Identify Sector Opportunities”, Kevin Lapham, of Ned Davis Research, explained,

The number of initial public offerings (IPOs) is a well-known, long-term indicator that can help confirm peaks and troughs in the stock market. Previous studies documented by Timothy Hayes have explored the relationship between an increase or decrease in the number of initial public offerings and the corresponding peak or valley in the broad market that often follows.

However, there is a lack of available information about the use of IPOs to perform sector analysis. Demonstrating the value of using a narrower perspective, this study will winnow the number of IPOs down to the sector level to provide a new market metric.

The theory behind the success of this indicator is twofold. First, investor sentiment can be gauged by the number of IPOs brought to market. Companies, venture capitalists, and investment banks will not benefit from the issuance of new shares unless there is ample investor interest in such an offering.

In studies by Norman G. Fosback, he stated “Companies sell stock to the public primarily when they need capital for expansion and related purposes. This usually occurs when business prospects are bright

and companies view their stocks as generously priced by the market.”

This can only happen effectively when investor sentiment is bullish and stock prices have been rising. In a 2006 Bloomberg news story, it was reported “Chief executive officers are turning to stock markets for financing now that the Standard & Poor’s 500 Index is near a four-year high.”

Second, the number of IPOs provides a measure of supply and demand. Norman G. Fosback (1985) also stated, “The new source of supply introduced into the market’s supply-demand equation also has the effect of diverting investment funds away from other stocks, thus exerting downward pressure on prices.”

Since stocks in a sector typically move in concert with one another, a number of IPOs within the same sector that begin to falter due to lack of buying interest and excess supply will weigh on all stocks in that sector.”

Among the many examples in the paper is the relationship between the tech sector IPOs and the tech heavy Nasdaq 100 Index.

information technology sector IPOs

Source: Using IPOs to Identify Sector Opportunities

In the chart, the number of IPOs and prices peaked at almost the same time. Lapham noted,

“A clear example of investor exuberance related to a specific market sector is that associated with the

Year 2000 tech bubble. In 1999, this sector outperformed all others with record momentum and an astounding 140% annual return.

An emerging internet/tech industry could not have existed without the huge investor appetite for shares of new issues. This unrestrained enthusiasm drove prices to unforeseen levels, resulting in one of the worst bubbles in decades.

The lower clip in [the chart] illustrates the spike in the number of technology IPOs per month in February 2000 (indicated by a down arrow). The solid line in the upper chart clip represents the NASDAQ-100 Index bubble top (indicated by an up arrow).

This is a unmistakable example of an increase in the number of IPOs correctly forecasting a bearish outcome which was realized after the year 2000. There were also successful sell signals during the early 1980’s.

Among the conclusions of the research are the facts that, “The IPO by Sector Indicator improves on broad market sentiment indicators by providing a more detailed view point of sentiment at the sector level.

This study illustrates that as the number of IPOs peaked in a particular sector, so did the risk that a price zenith was near. Moreover, the lack of IPOs in a sector was a strong indicator of an approaching base in that respective sector.

As demonstrated, even a trading model that relies solely on IPO data itself has historically been profitable.”

Based on recent news, it’s possible the indicator is flashing a warning to investors. There are a number of tech IPOs expected in the next few weeks.

Economy

More Big News From the Bond Market That Investors Must Be Aware Of

Many investors are familiar with the news that the yield curve inverted. The yield curve defines the relationship between Treasury securities.

Bloomberg took a broader view at the news and explained,

“Demand for government bonds gained momentum Wednesday, when U.S. central bank policy makers lowered both their growth projections and their interest-rate outlook. The majority of officials now envisages no hikes this year, down from a median call of two at their December meeting.

Traders took that dovish shift as their cue to dig into positions for a Fed easing cycle, pricing in a cut by the end of 2020 and a one-in-two chance of a reduction as soon as this year.

“It looks like the global slowdown worries have been confirmed and the market is beginning to price in Fed easing, potential recession down the road,” said Kathy Jones, chief fixed-income strategist at Charles Schwab & Co.

“It’s clearly a sign that the market is worried about growth and moving into Treasuries from riskier asset classes.”

inversion chart

Source: Bloomberg

The wave of buying that’s cut the 10-year yield by nearly 20 basis points in the last couple of days has global catalysts, too. Weaker-than-expected European factory data that helped drive benchmark German yields back below zero on Friday also supported the move.

An upended 3-month to 10-year curve is widely favored as an indicator that the economy is within a couple of years of recession. And Friday’s move is an extension of the inversion at the front end of the curve that happened in December. The gap between the 2-year and 10-year yields has also narrowed, to around 11 basis points.

That said, many downplay the curve’s predictive powers. Some argue that technical factors have distorted the curve’s shape and signaling capacity, particularly as crisis-era policy has tethered yields for the past decade. A downturn may be drawing near after what has been close to the longest expansion on record, however the market provides no precision on when it will happen.

While the 3-month to 10-year spread “has a relatively decent track record of predicting recessions, it suffers from a timing problem,” said TD Securities U.S. rates strategist Gennadiy Goldberg. “Its inversion can suggest a recession occurred six months ago or will occur two years from now.”

German Bonds Also Reach a Milestone

Less noticed than the inversion was an event in Germany where yield on 10 year bonds dropped below zero. Bloomberg reported,

“German 10-year bond yields dropped below zero for the first time in more than two years after the nation’s manufacturing sector fell deeper into contraction, compounding fears of an economic slowdown across the euro area.

The securities, seen as some of the safest that investors can buy, have rallied this year as inflation and growth data have disappointed, while the global economic outlook has also worsened. Friday’s move reverberated through to global markets, with the yield on benchmark Treasury notes falling to the lowest in more than a year.

sub-zero

Source: Bloomberg

Bund yields last dropped below zero percent in 2016, when the European Central Bank was still pumping money into the economy and the U.K. voted to leave the European Union.

The slide below the threshold again, following the conclusion of the ECB’s bond purchases and as the Brexit deadline approaches, has led to increased fears of a so-called Japanification of the region, where inflation, growth and yields remain permanently low.

“The breach of zero underlines how the Fed, BOE and ECB have created a carry environment and a hunt for yields that we haven’t seen for years,” said Arne Lohmann Rasmussen, head of fixed-income research at Danske Bank A/S. “It’s the crux of current market sentiment.”

The IHS Markit’s Purchasing Managers’ Index for German manufacturing fell to 44.7, the lowest since 2012 and well below economists’ median forecast of 48.

The data underlines why market expectations for the ECB’s first interest-rate increase since 2011 have been pushed toward the end of 2020, with the Federal Reserve also having put its rate-hiking cycle on hold.

Germany’s 10-year yield fell four basis points to zero percent, the lowest level since October 2016. Equivalent Treasury yields also dropped four basis points to 2.50 percent after touching 2.49 percent, a level not seen since January last year.

Demand for German bonds has also been boosted by political risks, from Brexit to Italian instability. EU leaders have staved off the risk of the U.K. crashing out of the bloc without a deal next Friday but only gave U.K. Prime Minister Theresa May an extra two weeks.

The German data was also followed Friday by a contraction in euro-zone manufacturing. Signs of a weaker economy in Europe and the U.S. or Brexit uncertainty may push bund yields further into negative territory, according to Rabobank.

“On top of the signal sent by the PMI manufacturing data, this comes on the back of dovish central banks,” said Antoine Bouvet, an interest-rate strategist at Mizuho International Plc. “The stars did align for this sort of move.”

What It Could Mean for Investors

This are important developments for investors to consider. There could be a global recession either underway or approaching.

Stock market prices are believed to discount the future which means that current prices reflect conditions that will occur in the future. In other words, if there is a recession in the future, stock prices are likely to fall before the recession even begins.

This is a warning for investors. Now could be the time to become more conservative in a portfolio, taking profits on some positions and allowing cash to build up. If aggressive positions are opened in the portfolio, it could be best to view them as short term trades with relatively close stops.

Options could also be used, perhaps buying long dated put options as insurance against a steep decline. Options carry limited risk and could deliver large gains if there is a significant decline in stocks. This could offset losses in other positions and allow an investor to recover from a potential bear market in less time.


Stock Picks

Shaq Might Just Be the Next Oprah

On the day that the yield curve inverted, one of the biggest winners on Wall Street was a pizza maker. As Barron’s reported,

“Papa John’s stock was heating up on Friday after the pizza company announced that NBA Hall of Famer Shaquille O’Neal will join its board and serve as an ambassador for the brand.”

The stock was up 6.2% on the day the news was released, an especially significant gain on a day when the S&P 500 Index was off by 1.9%.

PZZA daily chart

Barron’s explained the reason for the rally:

“Papa John’s (Nasdaq: PZZA) hopes it’s on the road to recovery after a disastrous run of bad press surrounding its founder, John Schnatter.

The trouble began in the fall of 2017 when Schnatter blamed declining sales on NFL protests. He stepped down as chairman in July after revelations that he used a racial slur in a conference call. Pizza Hut replaced Papa John’s as the NFL’s pizza partner in 2018.

Since then, the company distanced itself from Schnatter and removed his face from its logo and branding. Papa John’s has seen four straight quarters of downward 2019 earnings, earnings per share, and same-store sales revisions.

Activist fund Starboard Value is trying to turn things around. Starboard CEO Jeff Smith was named chairman of Papa John’s. The company is receiving $200 million from Starboard and said $100 million will be invested in the business.

What’s new. Papa John’s announced on Friday that O’Neal will join the board and invest in nine Papa John’s restaurants in Atlanta. He will also serve as a much-needed brand ambassador.

Since retiring from the NBA, O’Neal has become a fixture on TNT’s Inside the NBA post-game show. He’s also appeared in movies, videogames, and commercials.

This isn’t O’Neal’s first dive in the food industry. He owns a Krispy Kreme franchise in Atlanta and previously owned 27 Five Guys franchises. He also owns a fast casual fried chicken restaurant in Las Vegas and a fine dining restaurant in Los Angeles.”

The news service concluded that, “Bringing in O’Neal wont’s magically fix Papa John’s reputation. But it might be a good step.”

There’s a Precedent

Celebrities have invested in companies before. They have even joined the Board of Directors of companies they invest in. The most similar precedent could be Oprah Winfrey’s investment in Weight Watchers International, Inc. (Nasdaq: WTW).

After a recent decline in the stock, CNBC reported, “Winfrey’s original investment, however, is still in the black. She bought 6.4 million shares of Weight Watchers at $6.79 a share in October 2015, worth $43.2 million at the time, according to a Securities and Exchange Commission filing.

She also joined the company’s board of directors.

Last year, Winfrey sold some of her stake in the company. She now holds 5.4 million Weight Watchers shares, according to a January SEC filing.”

The chart below shows how the company has fared since then.

WTW weekly chart

There have been good times and bad since Oprah joined the team and she has received the credit and the blame at times.

One problem is that company is attempting to rebrand. After the latest earnings, according to CNBC,

“Weight Watchers is scrambling to clarify its new name, WW, and mission after a poorly executed rebranding campaign left consumers confused and membership numbers tanking.

The 55-year-old company started using the shorter name last year in an attempt to embrace wellness — a buzzy but vague term intended to promote a healthier lifestyle that would attract and retain customers long after they achieved their target weight.

The message fell flat with consumers. Weight Watchers is now forecasting a 10 percent drop in membership during the first quarter, the crucial diet season after the holidays that can make or break a diet companies’ entire year, the company said in releasing its fourth-quarter earnings…

Shares plunged by roughly 35 percent [on the news], erasing more than $48 million from Oprah Winfrey’s stake in the weight loss company.”

Analysts noted that,

While Winfrey is a powerful asset, the company’s reliance on her celebrity status also presents a risk.

“One of the bear criticisms for the stock is that Oprah is the whole reason for the company’s success,” Bolton Weiser said. “If they’re now saying they’re tying their whole advertising to her, doesn’t that fuel worries about the day Oprah decides not to be involved?”

Meanwhile, the company’s started adding back references to its former self after abruptly replacing the Weight Watchers name with WW in marketing materials in September. Its website and social media accounts now say: “WW. Weight Watchers reimagined.”

Branding expert Laura Ries said she was “stunned and shocked” when Weight Watchers changed its name last year. It’s never a good idea to switch to initials, “especially when no one uses the initials,” she said.

Oppenheimer analyst Brian Nagel said he wishes Weight Watchers would’ve made its changes last spring so they could’ve had more time to refine their messaging ahead of the key diet season.

Grossman said the company created new television and digital ads featuring testimonials from customers geared specifically to lapsed members. However, the new WW campaign failed to bring lapsed members back into the program, a key demographic the company relies on.”

That has all weighed on the stock according to CNBC:

“It’s gone from being a high flying growth company to being a beaten up kind of turnaround situation,” said Linda Bolton Weiser, an analyst at D.A. Davidson & Co.

Weight Watchers did not respond to requests for comment.

CEO Mindy Grossman told analysts Tuesday the company stands behind its strategy, blaming the results on a poorly executed marketing campaign. It’s now turning to Winfrey to help turn things around.

“If I was going to assess what the [problem] was, it wasn’t granular enough,” Grossman told analysts on a call Tuesday. “I think it needed to be more weight loss-focused, especially in the January season, and a more aggressive bridge from Weight Watchers to WW it needs to be more overt.”

Weight Watchers strayed too far from its core weight-loss mission too fast. Grossman assured analysts the company has already started massaging its message and will launch the new ad campaign with Winfrey this spring.

That’s not a bullish signal for PZZA.  The stock has been in a down trend for some time.

PZZA weekly chart

Shaq might help the company and could be part of its advertising. He does serve as a spokesman for several products and is widely recognized as engaging and entertaining. That could help PZZA recover but investors might want to see confirmation that the company has reversed course before diving in.


Economy

The Fed Might Have Triggered a Bear Market

Last week’s news from the Federal Reserve was significant. After a two day meeting, the Federal Open Market Committee announced that no rate hikes are likely in 2019. But there was more as Yahoo Finance reported,

“At the conclusion of its Federal Open Market Committee meeting, the Fed also announced that it will slow the rolloff of its balance sheet in May and then conclude its reduction at the end of September.

In keeping interest rates steady at the current target range of 2.25% to 2.5%, the Fed said said that the labor market “remains strong” but said economic growth has “slowed from its solid rate in the fourth quarter.”

The Fed statement said indicators have pointed to “slower growth” of household spending and business fixed investment.

The decision to hold rates steady was widely expected; fed funds futures headed into the meeting priced in a 98.7% chance of keeping rates where they are.

The FOMC’s summary of economic projections reflected toward revisions across the board as policymakers dampen their expectations for rate hikes in the future.

The “dot plots,” which chart FOMC voters’ estimates for where they feel benchmark interest rates should be in the next three years, had the median dot for 2019 at the current level of 2.25% to 2.5%.

FOMC participants' assessments of monetary policy

Source: Yahoo

That view — that no rate hikes would be appropriate for 2019 — came from an overwhelming majority of participants: 11 out of 17.

For 2020, the median dot sits only 25 basis points above that level, telegraphing that only one rate hike could be in the cards through the end of next year.

Those projections are a significant downward revision from the December FOMC meeting where policymakers raised by 25 basis points and said the economy could absorb “some further gradual increases.” For comparison, the median dots in the December dot plot signaled two rate hikes for 2019 and a third in 2020.

The lower outlook on rates falls in line with the Fed’s slightly lower expectations for GDP growth.

For 2019, the Fed brought down its median projection for GDP growth from 2.3% to 2.1%. The Fed also raised its 2019 median estimate for unemployment from 3.5% to 3.7%.”

Following the Market

Some commentators were surprised the Fed acted this way, worried that they are now following rather than leading the market. MarketWatch noted, “Even for a bond market bracing for an accommodative Federal Reserve, policy makers’ moves on Wednesday were a stunner, raising the specter of recession.

In particular, analysts said bond investors were taken aback by the sharp reduction of interest-rate-hike projections by the Federal Open Market Committee to zero from two back in December, as reflected in the central bank’s “dot plot” — a chart of Fed members’ projections for future rates.

On top of that, the Fed announced plans to end the runoff of its $4 trillion balance sheet in September and downgraded expectations for gross domestic product in 2019 to 2.1% from 2.3%.

Although the central bank held key rates at a range between 2.25% to 2.50%, as expected, the combination of other statements delivered a dovish jolt to fixed-income investors.

“This decision falls firmly on the dovish side of consensus as the about-face from ‘further gradual tightening’ has now reached a complete 180 degrees,” said Ian Lyngen, head of U.S. rates strategy at BMO Capital Markets, in a Wednesday note.

Lyngen said Tuesday’s rally in the bond market was justified by the Fed’s “dovish double-down,” referencing the decision by the FOMC in January to adopt a more patient policy after markets convulsed in late 2018.”

In the stock market, traders seemed to agree and major market averages were lower as the chart of the S&P 500 ETF (NYSE: SPY) shows.

SPY daily chart

After the Fed’s meeting, economists at the New York branch of the Federal Reserve lowered their outlook for the economy,

“The New York Fed Staff Nowcast stands at 1.3% for 2019:Q1 and 1.7% for 2019:Q2. News from this week’s data releases decreased the nowcast for 2019:Q1 by 0.1 percentage point and increased the nowcast for 2019:Q2 by 0.2 percentage point.

A positive surprise from the Philadelphia Fed manufacturing survey drove most of the increase for 2019:Q2, while higher-than-expected inventories accounted for most of the decline for 2019:Q1.”

Fed chart

Source: New York Fed

Analysts agree that the outlook for the economy is weaker,

“Now some on Wall Street are speculating the growth outlook is such that the Powell Fed will have to cut interest rates later this year. Wait, what?

“The Fed’s revised economic projections, which now imply no rate hikes this year, may have been a bit more dovish than most anticipated, but we think their underlying economic forecasts are still too upbeat. We expect economic growth to remain well below trend throughout 2019 which is why we think the Fed’s next move will be to cut interest rates,” says Capital Economics senior U.S. economist Michael Pearce.

“The decision to leave the target for the fed funds rate unchanged at 2.25-2.50% was unanimously expected, but the sharp drop in Treasury yields following the decision suggests investors were surprised by the dovish tone of the accompanying statement and economic projections,” adds Pearce.

“The Fed does not want to get into the business of predicting the outcome of political decisions, at least publicly, but the removal of both 2019 dots suggests to us that they are much more worried about external risks than we believe is justifiable as a base case,” Pantheon Macroeconomics Chief Economist Ian Shepherdson explains.”

Where does all this leave investors? It should leave investors concerned. The Fed is forecasting slow economic growth. Wall Street analysts are forecasting slower earnings growth. This is a potential setup for lower stock prices.

If there is a bear market accompanied by a recession, the probability of a steeper than average decline should be expected. In the past, bear markets during recessions have resulted in price declines averaging more than 30%.

Investors could ignore the events associated with the Fed, but the possible risks are high and the potential gains may not outweigh those risks.


Stock market strategies

The Yield Curve Inversion Could Mean It’s Time to Panic

The yield curve can be a concept that is a challenge to understand for some investors. It might be best to start by defining the yield curve.

If someone asks, “what’s the interest rate?” that question doesn’t mean very much. At any given time, there are rates for car loans, mortgages, savings account and a variety of other uses. There are also different rates within each use depending on the amount of time the rate covers.

The safety of the loan is another factor that is important in determining the interest rate.

For example, think of a car loan. There are often different rates for new cars or used cars. There are different rates for new cars for consumers with different credit scores. There are also different rates for 3 year loans than 5 year loans. There are other factors but that is enough to detail the yield curve.

Let’s limit the problem to rates for a new car with consumers having credit scores between 700 and 725. These consumers will be offered loans for 1 years, 2 years and 3 years. We can plot the interest rates on the vertical axis of a chart and the length of a loan on the horizontal axis. That’s a yield curve.

interest rate chart

In this example, the chart shows the yield curve. Notice that it slopes higher as we increase the length of the loan period. That’s a normal yield curve because risks increase with the length of the loan and lenders will demand higher interest rates to compensate them for those risks.

Investors usually follow the yield curve for Treasuries. These are securities that are issued for periods as short as one month to as long as 30 years. Issued by the US government, Treasury securities are assumed to be free form default risk.

The Shape of the Curve Is an Indicator

The current yield curve is shown in the chart below.

trail length chart

Source: StockCharts.com

Right now, an inverted yield curve can be seen. This is a yield curve where the shorter term yields are higher than the longer term yields, which can be a sign of upcoming recession.

Economists, in addition to stock market analysts have studied the yield curve. In particular, economists at the Cleveland Branch of the Federal Reserve have reviewed the usefulness of the curve as an economic forecasting tool. They note:

“The slope of the yield curve—the difference between the yields on short and long term maturity bonds—has achieved some notoriety as a simple forecaster of economic growth.

The rule of thumb is that an inverted yield curve (short rates above long rates) indicates a recession in about a year, and yield curve inversions have preceded each of the last seven recessions (as defined by the NBER).

One of the recessions predicted by the yield curve was the most recent one. The yield curve inverted in August 2006, a bit more than a year before the current recession started in December 2007. There have been two notable false positives: an inversion in late 1966 and a very flat curve in late 1998.

More generally, a flat curve indicates weak growth and, conversely, a steep curve indicates strong growth. One measure of slope, the spread between ten year Treasury bonds and three month Treasury bills, bears out this relation, particularly when real GDP growth is lagged a year to line up growth with the spread that predicts it.”

The chart below summarizes this relationship.

yield curve spread

Source: Federal Reserve

What This Means for the Stock Market

Economists have found that the shape of the curve is important. This is logical. When the economy is growing, demand for money should increase. This will push interest rates up. We expect rates on a 10 year loan, for example, to be higher than the rate of a 30 day loan. That relationship is the curve.

As demand for money decreases, potential borrowers are signaling that they have fewer investment opportunities. Lower demand leads to a decline in interest rates. The longer term loans should see the greatest decrease in demand and the curve should flatten, or even invert.

To convert this idea into a useful indicator, we could simply subtract the value of short term rates from the value of long term rates. This results in the next chart which subtracts the interest rate on 2 year Treasuries from the interest rate in notes with 10 years to maturity.

10-year Treasury

Source: Federal Reserve

The chart shows that the curve inverted before the 2000 and the 2008 bear markets. The down trend in the curve reflects the slowing economic growth that has characterized the current economic expansion.

In the chart, we can see that the trend in the yield curve is down but we also see that the current level of the difference between long and short term rates is not yet inverted. The inversion exists between 2 year and 5 year maturities.

What to Watch For

Of course, the yield curve will change over if it does invert, that’s a signal to expect a recession. But, for now, different curves are telling different stories.

As Barron’s recently noted, there is currently an inversion between 3 month Treasury bills and the ten year Treasury note. There are other inversions along the 30 year spectrum of the Treasury yield curve.

“Experts are split on which yield curve is the most reliable, but the Fed prefers looking at the curve between the 10-year and three-month Treasuries, which on Friday turned negative, to minus 0.196 percentage points.

While a yield curve inversion has preceded recent recessions, it doesn’t happen immediately, and the lead time has been very inconsistent. Historically, a recession can come anywhere from one to two years after the curve flips upside-down, and the stock market usually continues to gain from the day of the inversion until its cycle peak.

So we’ve got more time to watch.”

That’s all that investors can do for now but it is important that they watch.


Stock market strategies

This Market Expert Says Be Careful With Yields

Mortgage real estate investment trusts, or mREITs, help provide essential liquidity for the real estate market. mREITs invest in residential and commercial mortgages, as well as residential mortgage backed securities (RMBS) and commercial mortgage backed securities (CMBS).

mREITs typically focus on either the residential or commercial mortgage markets, although some invest in both RMBS and CMBS.

REITs hold mortgages and MBS on their balance sheets and fund these investments with equity and debt capital. Their general objective is to earn a profit from their net interest margin, or the spread between interest income on their mortgage assets and their funding costs. mREITs rely on a variety of funding sources, including common and preferred equity, repurchase agreements, structured financing, convertible and long term debt and other credit facilities. mREITs raise both debt and equity in the public capital markets.

mREITs typically use less borrowing and more equity capital to finance their acquisitions of mortgages and MBS than do other large mortgage investors.

There are dozens of publicly traded mREITs and some offer double digit yields. But one expert is warning that those yields could be at risk.

mREITs

Source: REIT.com

An Expert Worth Listening To

James Grant founded Grant’s Interest Rate Observer, a twice monthly journal of the financial markets, in 1983. He has been involved in interest rate markets since the late 1960s.

James Grant Photo

Source: Grant’s Interest Rate Observer

Grant’s books include three financial histories, a pair of collections of Grant’s articles and three biographies.  Grant is a 2013 inductee into the Fixed Income Analysts Society Hall of Fame. He is a member of the Council on Foreign Relations and a trustee of the New York Historical Society.

His opinion is widely followed on Wall Street and his recent column in Barron’s carried an important warning for investors on Wall Street and Main Street.

His conclusion is an honest assessment of one mREIT in particular but applies to the entire sector and to the enter world of finance, “So that 12% yield is a hope—a not unreasonable one, but, still, a hope.”

The warning is that high yields should be considered a sign of hope rather than a source of steady and safe income. In fact, the higher the yield, the less the income should be assumed to be.

A Specific Investment of Hope

Grant was writing about AGNC Investment (Nasdaq: AGNC). This REIT has not been around long enough to include an environment when interest rates were normal. It has performed very well since 2009, but many investment opportunities can claim that as an accomplishment.

AGNC monthly chart

AGNC invests mainly in 30 year federal agency mortgage backed securities. It is the second largest mREIT behind Annaly Capital Management (NYSE: NLY). NLY has a longer track record and did experience the 2009 bear market when it fell 48%, after dividends are considered.

NLY monthly chart

Over the past ten years, AGNC delivered a total return of 368% while the larger NLY gained 148%, both values assume that dividends are reinvested.

Grant writes that, “Nobody guarantees that 12% yield. It depends on the skill of the manager, the shape of the yield curve, the perceived direction of Federal Reserve policy, and the propensity of encumbered American homeowners to refinance their mortgages.

It’s the latter consideration, especially, that can turn the unassuming mortgage backed security into a kind of options bomb.

Even so, lots can go wrong—across the mortgage REIT industry, lots does go wrong. AGNC uses $9 of debt for every $1 of equity. The cheaper the cost of its liabilities in relation to the yield on its assets, the better it is for its dividend recipients.

But while, in the fourth quarter, the yield on AGNC’s assets rose by eight basis points—each equal to 1/100th of a percentage point—the cost of the corresponding liabilities jumped by 21 basis points.

Interest rates can get you coming and going. As of Dec. 31, interest rate hedges covered 94% of AGNC’s funding liabilities. Yet the fourth quarter delivered an 8% decline in tangible book value per share and a net loss of $1.61 per share.

Since the third quarter of 2016, tangible book value per share has dropped by 22%. At today’s price of $17.98, the stock changes hands at 103% of that diminished book.

The very nature of mortgage backed securities makes for trouble—they must be, by far, the most perverse securities in the bond market. When rates fall, mortgagors refinance and AGNC’s appreciating assets get called away.

Symmetrically, when rates rise, prepayments plummet and AGNC’s depreciating assets stubbornly stay put. MBS leave when you want them to stay and stay when you want them to leave. “Negative convexity” is the polite term for this confounding mortgage characteristic.

Since AGNC and its ilk are, in effect, short interest rate volatility, a nice, steady positively sloped yield curve is how they thrive. Volatility throws their rate hedges out of sync and plays ducks and drakes with the duration, or interest rate sensitivity, of their portfolios.”

AGNC management notes that, “If interest rates are going up, and our portfolio is getting longer, I have to sell bonds to shorten our duration or I have to pay on interest rate swaps, and I will be doing that at higher yields or lower prices.

Conversely, I have to add duration to the portfolio if interest rates rally [i.e., decline] significantly, and there is a cost associated with buying high.

In a sense, the worst case scenarios are big moves back and forth. Not small moves—10, 15, 20 basis points (we’re not going to do much rebalancing with those) but down 50 basis points, up 50 basis points, back and forth.

You’d end up spending a fair amount of money rebalancing your portfolio if those moves were quick and often.”

This indicates that AGNC performs best when interest rates are on a steady path. That has largely been the case since 2008. But in recent months Federal Reserve policy has become less certain and that could create a worst case scenario for AGNC and other mREITs.

Now might be a good time to limit exposure to the highest yielding investments since the high yield, as Grant notes, is a sign of hope and hope is rarely, if ever, a good investment strategy.


Did you know that dividends have rewarded investors for at least 100 years, at least since John D. Rockefeller said, “Do you know the only thing that gives me pleasure? It’s to see my dividends coming in.”

We have prepared a special report about dividends that you can access right here.

Stock market

This Might Be the Best Way to Look at Boeing as an Investment

When it comes to corporate disasters, the thought of Boeing may be on the mind of many investors.

Boeing’s brand-new fleet of 737 Max aircraft was grounded in over 40 countries after a deadly plane crash in Ethiopia, the second 737 Max to go down in five months, according to The New York Times.

“There’s no hard evidence that the planes have anything wrong with them, but similarities between the two crashes caused widespread concern among aviation officials (and passengers) around the world.

Boeing has promised a software fix and new training program for pilots by April, but it may take a lot longer to repair the damage to its reputation and its bottom line, considering the 737 Max was its best-selling jet ever.”

The stock has sold off on this news.

BA daily chart

History Shows a Possible Precedent

This isn’t the first time Boeing (NYSE: BA) has faced a problem that involved grounding of its planes.

“Boeing’s Dreamliner was grounded in 2013,” The New York Times noted and “it took more than $20 million and three months to fix the problem. The crisis over its 737 Max jet could be even harder to manage, given the incalculable reputational risk after two fatal crashes.

The short-term costs such as a software fix to the plane are likely to be manageable for Boeing, but the bigger financial unknown is whether airlines lose confidence in the Max, the company’s best-selling jet. Some 4,600 planes are on order, accounting for around $550 billion in future revenue.

A partial list of customers is shown below.

partial customer list

Source: The New York Times

“Reputationally and financially, this is painful,” said Richard Aboulafia, vice president of analysis at Teal Group Corp., a consulting firm.

With all of the Max planes now grounded around the world, Boeing’s first priority is developing a fix. Boeing has been working with American regulators to roll out a software update and new training guidelines in the months since the first crash, off Indonesia in October. The update is expected by April, but a final solution could take more time depending on what investigators determine happened in the Ethiopia disaster.

The longer it takes to find a solution, the higher the price tag. The battery fix for the Dreamliner jets amounted to $465,000 per plane, according to Carter Copeland, an analyst at Melius Research. Based on those costs, he estimates that Boeing could spend nearly $1 billion to resolve issues with the 737 Max fleet.

Airlines, which have 350 of the planes in their fleets, have also begun to demand compensation for their losses during the grounding. It costs an estimated $1 million to lease a replacement jet for three months.

“It’s quite obvious that we will not take the cost related to the new aircraft that we have to park temporarily,” said Bjorn Kjos, the chief executive of Norwegian Air, which had to take 18 of the planes out of service after an order from European regulators on Tuesday. “We will send this bill to those who produce this aircraft.”

Boeing could also face lawsuits from the families of passengers who died in the disasters. The Dreamliner had battery problems but never crashed.

Handling the Problem as a Corporation

A company the size of Boeing will probably be able to absorb such costs. Boeing, an aerospace giant that builds commercial and military aircraft, makes more than $100 billion in revenue a year.

The bigger challenge for Boeing is how it will handle future orders. If deliveries are delayed because the plane needs to be redesigned, the manufacturer is likely to have to offer discounts to carriers with orders.

There is also a broader risk that, if the passenger backlash to the Max lasts, the manufacturer could lose some corporate customers in the long run. Such a shift would give an advantage to its European rival Airbus, which makes a similar fuel-efficient plane, the A320neo.

But it’s unlikely that airlines will cancel their Max purchases outright. Carriers typically put down a deposit of around 20 percent for their orders on the $120 million plane, which is paid out over time. It can be difficult to get out of those commitments without solid evidence that there’s a structural problem with the aircraft, airline executives and analysts said.

Even if customers could walk away from their Boeing orders without losing money, they probably wouldn’t. The aircraft manufacturing business is essentially a global duopoly. And Airbus has a yearslong backlog.

“I don’t think anyone will abandon them,” said Jonathan G. Ornstein, the chief executive of Mesa Airlines, who operated a fleet of 737s in his previous role at the helm of Virgin Express, a European airline. Mr. Ornstein called Boeing “customer-centric” and said he expected that the company would bend over backward to maintain its rapport with carriers.

The Problem for Investors

While the company faces problems, so does the stock. Again, investors could look to precedent. As Barron’s explained,

“Boeing Gets Two Orders for 737-400,” read a short item in the Seattle Times in March 1990.

Looking back, it illustrates how even dire news can eventually fade. There was no mention that the plane was coming off two deadly crashes during its first full year of service. In January 1989, a British Midland plane crash-landed onto a highway embankment, killing 47 of 126 aboard.

That September, a USAir flight skidded off a LaGuardia airport runway into the East River of New York, killing two of 63.

Six months after the second accident, Boeing stock was 20% higher. Both crashes involved pilot error linked in part to unfamiliarity with the 737-400, but both also resulted in the company making changes to the plane.

Orders continued apace for a decade. As of last summer, there were more than 250 of the planes still in service.”

That incident is now lost in the chart.

BA monthly chart

The same pattern could repeat itself. Boeing is unlikely to go out of business as one of the world’s few suppliers of aircraft. That means the stock could be worth watching as a potential buy in the coming weeks or months.


Did you know that dividends have rewarded investors for at least 100 years, at least since John D. Rockefeller said, “Do you know the only thing that gives me pleasure? It’s to see my dividends coming in.”

We have prepared a special report about dividends that you can access right here.

Stock market

This Obscure Indicator Can Help You Beat the Market

Many investors use indicators. Popular fundamental indicators include the price to earnings (P/E) ratio and the dividend yield. Popular technical indicators include moving averages and the relative strength index or RSI. Less popular are economic indicators.

When investors do consider economic indicators, they often look at the so called headline numbers. This might include the unemployment rate or an inflation report. Even less well known are obscure indicators like the ECRI Weekly Leading Index.

ECRI is the Economic Cycle Research Institute, an organization with a long history. As ECRI explains,

“A century-long tradition of business cycle research gives ECRI a singular perspective on the ebb and flow of the economy, even in the face of unexpected shocks. Our approach is informed by the fundamental drivers of economic cycles.

It is an approach pioneered by ECRI’s co-founder, Geoffrey H. Moore, and his mentors, Wesley C. Mitchell and Arthur F. Burns.

In 1950, Moore built on his mentors’ findings to develop the first leading indicators of both revival and recession. In the 1960s he developed the original index of leading economic indicators (LEI). It is a testament to the quality of that breakthrough that, nearly half a century later, many still believe the LEI and its variants to be the best tools for cycle forecasting.

However, building on that foundation, by the late 1990s ECRI had put together a far more sophisticated framework for analyzing international economic cycles that remains at the cutting edge of business cycle research and forecasting.”

The ECRI Leading Index is shown in the chart below.

ECRI Leading Index

Source: BusinessCycle.com

This index has a moderate lead over cyclical turns in U.S. economic activity. Historical data begins in 1967. The indicator is designed to predict the timing of future changes in the economy’s direction.

The Leading index is intended to “signal those turns before the fact, and well before the consensus. ECRI’s focus is on identifying when those changes in direction will occur.” An explanation of a leading index is shown next.

leading indexes chart

Source: BusinessCycle.com

To help assess where we are in the cycle, it is common to consider the year over year change in economic data. That change is shown in the next chart.

weekly leading index chart

Source: BusinessCycle.com

The year over year change is now below zero, an ominous signal for the economy.

ECRI has warned that the economy could be approaching a recession.

The problem is … the cyclical drivers of economic growth continue to wind down, meaning that the slowdown is set to continue. That’s the objective message from the same array of leading indexes that we used to predict the current U.S. economic slowdown in the context of a global slowdown last year.

A case in point is the publicly available U.S. Weekly Leading Index, whose growth rate remains in a cyclical downswing.

If the U.S. slowdown continues until the opening of a recessionary window of vulnerability, within which almost any negative shock would trigger recession, it will be too late for the Fed to head off a hard landing, as it was before the 2001 and 2007-09 recessions.

Today, despite the risk-on rally, a couple of conflicting concerns linger – fears of recession down the road and residual worries about resurgent inflation. To be sure, a recession isn’t imminent, but it’s not off the table. At the same time, a renewed upswing in inflation is nowhere in sight.”

Does It Work?

ECRI is an independent research group and their work is highly respected. They have back tested their indexes and have an impressive track record. One example shows how their research worked in the past, correctly identify the turning points in the early 1990s.

U.S. leading services index

Source: BusinessCycle.com

More recent forecasts include a warning in October 2018 that ““The global industrial slowdown we first forecast a year ago is in full swing and set to worsen. Meanwhile, with purchasing managers indexes actually lagging last November’s peak in global industrial production growth, the consensus was caught behind the curve.”

Investors who heeded that caution could have decreased their exposure to the stock market and avoided some of the decline that marked the fourth quarter last year.

Current Outlook

ECRI recently noted,

“Today, our research shows that the U.S. economy is approaching a recessionary window of vulnerability. But it isn’t yet in that window, so the economy remains relatively resilient to shocks. Therefore, while our lonely forecast last year of a cyclical slowdown in growth has now proven correct, it’s premature to conclude that a recession is imminent.

Our track record isn’t perfect, but we have been consistent in making some of the most impactful predictions in recent history. We made a timely U.S. recession call well ahead of the Lehman Brothers collapse. We were then virtually alone early the next spring in correctly predicting the end of the Great Recession in real time.”

Investors can follow ECRI’s indexes or turn their attention to important economic indicators. Economist tend to watch four indicators for signs of recessions:

  • Nonfarm Employment
  • Industrial Production
  • Real Retail Sales
  • Real Personal Income (excluding Transfer Receipts)

The recent readings of these indicators is shown in the next chart:

Big Four Indicators

Source: AdvisorPerspectives.com

Analysts noted, “The US economy has been slow in recovering from the Great Recession, and the overall picture has been a mixed bag. Employment and Income have been relatively strong. Real Retail Sales have been rising but below trend. Industrial Production has been slow to recover and has finally been showing signs of improvement.”

This data has been delayed by the government shutdown. Some economists question the data as it is released believing that there could be problems with data gathering associated with the shutdown and are waiting for revisions.

But, for now, the big four are supportive of an economic expansion even if the picture is weakening. As ECRO notes, a recession isn’t imminent, but it’s not off the table. That means investors should be attentive to economic indicators, even if it is not popular to do so.

Watching for signs of additional weakness could help investors avoid a sharp downturn in the stock market that often accompanies recessions.


Did you know that dividends have rewarded investors for at least 100 years, at least since John D. Rockefeller said, “Do you know the only thing that gives me pleasure? It’s to see my dividends coming in.”

We have prepared a special report about dividends that you can access right here.

Economy

Business Execs Are Increasingly Worried About Recession

Every quarter, executives of large companies share their outlook with analysts in conference calls after earnings are announced. In these calls, management often discusses items that are of concern. According to FactSet, the strong dollar is among the primary concerns of many companies.

S&P 500 chart

Source: FactSet

Specific markets can also be a concern, as Apple noted, “In fact, most of our revenue shortfall to our guidance, and over 100 percent of our year-over-year worldwide revenue decline, occurred in Greater China across iPhone, Mac and iPad. China’s economy began to slow in the second half of 2018.

The government-reported GDP growth during the September quarter was the second lowest in the last 25 years. We believe the economic environment in China has been further impacted by rising trade tensions with the United States.”

These concerns sent shares of Apple lower in January.

AAPL daily chart

Rising Fears of an Economic Slowdown

Analyzing these calls can offer valuable insights to investors. That’s especially true when common themes emerge from the calls and that appears to be happening according to analysts at Gartner,

“Analysis of S&P 500 2018 earnings transcripts shows fading exuberance among corporate executives as the year progressed, according to Gartner, Inc. Several sectors are undergoing an earnings recession, and efficiency and restructuring initiatives are increasingly common.

“S&P 500 company executives are concerned about the risks and uncertainty from government interventions rather than suspecting any global macroeconomic downturn in the near term,” said Tim Raiswell, vice president at Gartner’s finance practice. “Talk of capital and cost-efficiency programs was increasingly common in earnings calls as 2018 progressed.”

“Mentions of the words ‘downturn’ and ‘slowdown’ were four times more likely to appear in earnings call in 4Q18,” said Mr. Raiswell. “Yet it’s important to consider that 4Q18 brought relatively extreme drops in stock prices. After 10 years of economic expansion, it’s not surprising to see analysts asking company executives about their preparations for cyclical economic weakness.”

Most executives, however, remained optimistic about the U.S. economy in 2019. The companies most exposed to China were more likely to report demand weakness in 2018, or predict it occurring in 2019. Sentiment was particularly positive in the technology and communications sectors.

“Even while expressing a broadly positive economic outlook, many of the world’s largest companies are starting to behave as if they are in a recession,” said Mr. Raiswell. “Ford, Pepsi and P&G are all recent high-profile examples of companies announcing large-scale efficiency programs.”

The most commonly cited economic concern was the slowing Chinese economy.

China's economic growth slows

Source: Statista

This theme emerged strongly in 4Q18 and has since picked up momentum in 2019 earnings calls. Much of this concern for China and the wider global economy outside the U.S. was more related to unpredictable government interventions than to any strong conviction of underlying economic weakness.

Common U.S.-related concerns were the recent government shutdown, tariffs and trade policy uncertainty. Worldwide political issues cited were Brexit and the fractious political landscape within the Eurozone, as well as concerns in the Middle East and in South America.

“Given the lack of realistic precedents in many cases, all parties are largely guessing about the extent to which political rhetoric will become firm policy and what the impact will be on companies’ order books,” said Mr. Raiswell.

“In this uncertain environment and after a long stretch of expansion since 2009, a significant number of leading firms are taking a recessionary stance and making preparations to capitalize on a downturn rather than be a casualty of one.”

The growth of nonbank lending emerged clearly in financial services earnings calls. Nonbanks offer high-risk loans to consumers at prices that many banks are not willing to match. This strong competition is why the theme emerged in earnings conversations.

“While many economists suspect that the next U.S. recession will take a different form than the financial liquidity crisis of 2009, there should be concerns among CFOs and treasurers that this growth of nonbank lending poses a risk to the U.S. financial system. Nonbank portfolios tend to be built on higher-risk loans to low-income clients. A combination of this phenomenon and any future easing of banking and lending regulations could spell trouble for the global economy in the next few years,” said Raiswell.

Other Trends

Many large firms reported that cost management initiatives are well underway, largely targeting overhead categories such as marketing, advertising and finance, as well as direct industrial production costs.

For example, P&G, Estée Lauder, Whirlpool and others all detailed significant firmwide productivity programs. Several vehicle manufacturers, such as Honda, Ford and Nissan, began initiatives to consolidate their production in fewer facilities to drive efficiencies. Many more firms reported deliberately lower capital expenditure than expected in 2018, as growth capital was reallocated.

“The CFO’s posture is critical now. Gartner cautions against a ‘business as usual’ approach that fails to change a winning formula when faced with turns in market direction,” said Mr. Raiswell.

“While signs of early preparation bode well for company performance, if a downturn appears, this preemptive behavior does raise questions. How much further will executive teams have to cut costs if demand plummets, and will this take the form of more-drastic forms of restructuring, such as layoffs and divestitures?”

Other analsyst saw similar themes. CNBC reported, “As this earnings season starts wrapping up, a common theme emerged from hundreds of conference calls: Managers had difficulty providing concrete guidance for 2019 earnings due to the uncertainty around trade, according to David Kostin, chief U.S. equity strategist at Goldman Sachs.

“Several management teams assumed that the March 1 tariff rate increase would occur. However, some firms remained optimistic about the prospects for a deal in 2019. Additionally, firms are seeing the impact of increased uncertainty in customer decision making,” Kostin said in a note.

The tone of the calls appears to have been generally concerned. There is less cause for alarm when management is muted but there is cause for concern since the calls were low on optimism. Uncertainty about trade, efforts to reduce costs and fears of recession could weigh on earnings.

These factors could also weigh on stock prices and with stock prices extended, now could be a time for investors to exercise caution as the executives of major companies are.


Did you know that dividends have rewarded investors for at least 100 years, at least since John D. Rockefeller said, “Do you know the only thing that gives me pleasure? It’s to see my dividends coming in.”

We have prepared a special report about dividends that you can access right here.