Uber, Lyft and Pinterest Could Be Signaling Investors
CNBC is warning that “Euphoric IPO market may be a troubling sign for stocks” and the article notes,
“Billion-dollar private companies are stampeding to go public this spring. But fear, not excitement, may be driving the herd.
After a slow first quarter for public offerings, denim giant Levi Strauss kicked off its debut [in March] with shares popping 31 percent on the New York Stock Exchange.”
The stock did not hold its gains after trading began.
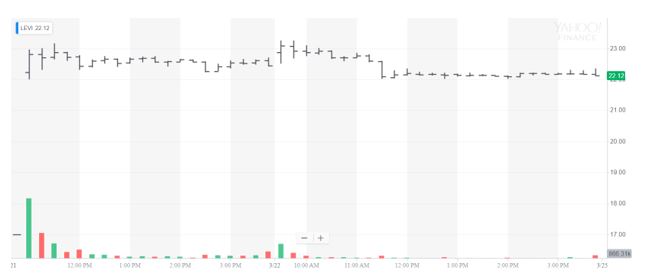
Source: Yahoo
CNBC continued, “The ride-hailing service Lyft is next up to bat and is expected to hit a $23 billion valuation when it lists on the Nasdaq next week. The social media app Pinterest has moved up its timeline to list, filing its IPO prospectus with the SEC on Friday.
Uber, with a jaw-dropping $120 billion target valuation, is planning to release its filing and kick off an IPO roadshow in April, according to Reuters. Slack and Palantir are also on deck in 2019.
But a re-energized, euphoric IPO market is not necessarily a bullish sign, according to some industry experts. It could indicate private investors in these companies want to cash in their chips.
This month’s excitement traces back to the end of last year. A lot of these companies could have listed in the second half of 2018 but put it off. Then came December, the worst month for stocks since the Great Depression.
Larry McDonald, managing director of ACG Analytics, said Silicon Valley clients he has spoken with behind the scenes regretted not listing before the December dip.
“They should have done these deals all last year, and they put it off,” said McDonald, who is also the editor of the Bear Traps Report. “The beatings that these guys took for not bringing those deals in the third quarter were substantial.”
Beatings mostly took the form of criticism on their risk management, McDonald said. But luckily for the start-ups, comments from the Federal Reserve have saved the day.
The Fed has suggested no rate increases would come this year — after indicating in December that two could take place. The newest stance sent stocks higher, providing a solid backdrop for these companies to now go public.
Many private equity and venture capital investors are now “panicked to just get out,” McDonald said.
Today’s IPOs are essentially, a “very bright private equity crowd desperately hitting a fleeting late cycle bid after missing that bid in Q4 and looking down the barrel of a 20 percent U.S. equity market drawdown,” McDonald said.
Larry Haverty, managing director at LJH Investment Advisors said the first-quarter rush to go public is “greed more than fear.”
“That will keep happening until the lights are turned off,” Haverty told CNBC in a phone interview. “IPO booms almost never end well.”
Based on the over-subscription of Lyft’s IPO and successful Levi’s entry, he said investment bankers are likely looking to rush these deals out the door. Bankers are likely telling clients, “the window is open but this Lyft and Levi Strauss is a period of insanity and we better get in on this.”
“It’s finance 101 — make hay while the sun shines,” Haverty said. “If you’re a tech company looking at selling stock now, there’s no reason on God’s green Earth that you wouldn’t sell it.”
Research Backs the Analysts
In “Using IPOs to Identify Sector Opportunities”, Kevin Lapham, of Ned Davis Research, explained,
The number of initial public offerings (IPOs) is a well-known, long-term indicator that can help confirm peaks and troughs in the stock market. Previous studies documented by Timothy Hayes have explored the relationship between an increase or decrease in the number of initial public offerings and the corresponding peak or valley in the broad market that often follows.
However, there is a lack of available information about the use of IPOs to perform sector analysis. Demonstrating the value of using a narrower perspective, this study will winnow the number of IPOs down to the sector level to provide a new market metric.
The theory behind the success of this indicator is twofold. First, investor sentiment can be gauged by the number of IPOs brought to market. Companies, venture capitalists, and investment banks will not benefit from the issuance of new shares unless there is ample investor interest in such an offering.
In studies by Norman G. Fosback, he stated “Companies sell stock to the public primarily when they need capital for expansion and related purposes. This usually occurs when business prospects are bright
and companies view their stocks as generously priced by the market.”
This can only happen effectively when investor sentiment is bullish and stock prices have been rising. In a 2006 Bloomberg news story, it was reported “Chief executive officers are turning to stock markets for financing now that the Standard & Poor’s 500 Index is near a four-year high.”
Second, the number of IPOs provides a measure of supply and demand. Norman G. Fosback (1985) also stated, “The new source of supply introduced into the market’s supply-demand equation also has the effect of diverting investment funds away from other stocks, thus exerting downward pressure on prices.”
Since stocks in a sector typically move in concert with one another, a number of IPOs within the same sector that begin to falter due to lack of buying interest and excess supply will weigh on all stocks in that sector.”
Among the many examples in the paper is the relationship between the tech sector IPOs and the tech heavy Nasdaq 100 Index.
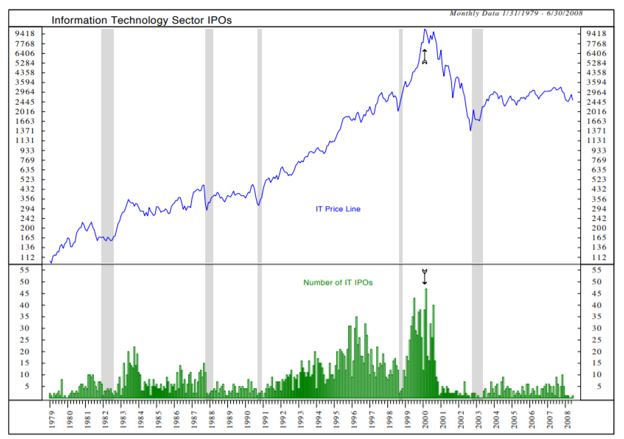
Source: Using IPOs to Identify Sector Opportunities
In the chart, the number of IPOs and prices peaked at almost the same time. Lapham noted,
“A clear example of investor exuberance related to a specific market sector is that associated with the
Year 2000 tech bubble. In 1999, this sector outperformed all others with record momentum and an astounding 140% annual return.
An emerging internet/tech industry could not have existed without the huge investor appetite for shares of new issues. This unrestrained enthusiasm drove prices to unforeseen levels, resulting in one of the worst bubbles in decades.
The lower clip in [the chart] illustrates the spike in the number of technology IPOs per month in February 2000 (indicated by a down arrow). The solid line in the upper chart clip represents the NASDAQ-100 Index bubble top (indicated by an up arrow).
This is a unmistakable example of an increase in the number of IPOs correctly forecasting a bearish outcome which was realized after the year 2000. There were also successful sell signals during the early 1980’s.
Among the conclusions of the research are the facts that, “The IPO by Sector Indicator improves on broad market sentiment indicators by providing a more detailed view point of sentiment at the sector level.
This study illustrates that as the number of IPOs peaked in a particular sector, so did the risk that a price zenith was near. Moreover, the lack of IPOs in a sector was a strong indicator of an approaching base in that respective sector.
As demonstrated, even a trading model that relies solely on IPO data itself has historically been profitable.”
Based on recent news, it’s possible the indicator is flashing a warning to investors. There are a number of tech IPOs expected in the next few weeks.