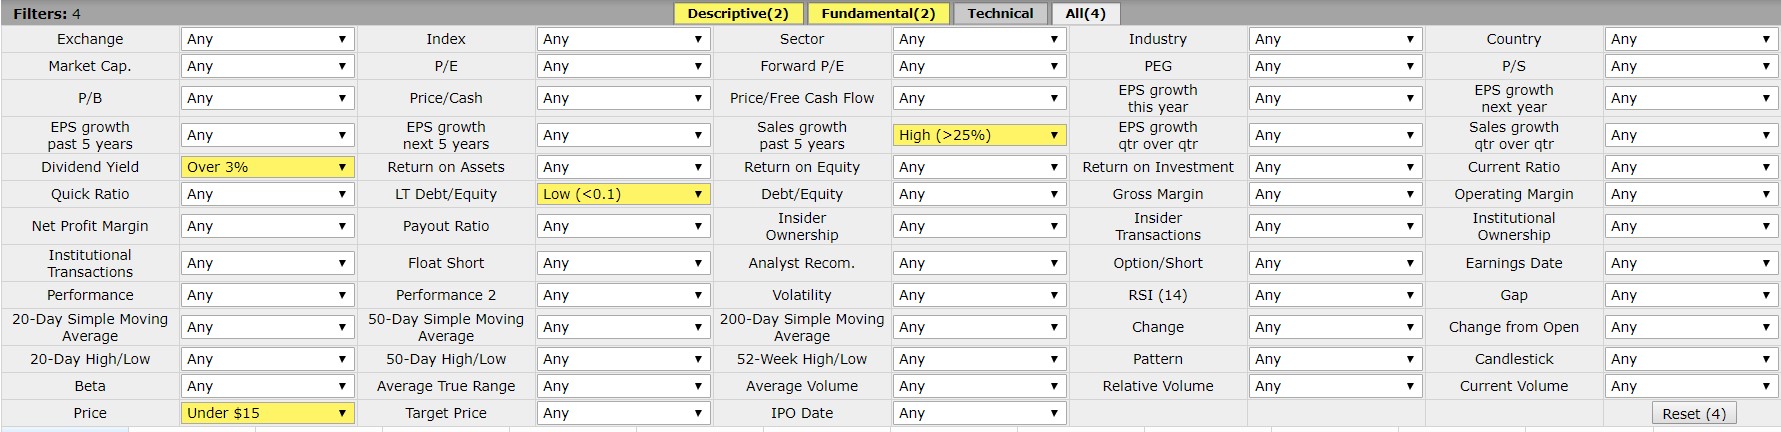
Many investors seek out dividends as a means of providing a return that isn’t based on a company’s share price. There are several factors to consider when buying a company for dividends. Some of those factors are dividend yield, consistency of historically paying the dividend, the dividend growth rate and the type of corporate structure (equity, equity REIT, Mortgage REIT, MLP, etc.). In this list we’re including traditional equities and equity REITs that pay over a 5% dividend yield.
The approach to evaluating equity and equity REITs is a little different. In both of these types of investments it’s important to consider the cash flow the company is generating and the valuation, but the way the companies are analyzed is different. For example, free cash flow (FCF) would be important for equities and funds from operations (FFO) would be important for REITs. In the case of valuation, measure like price-to-FFO (P/FFO) would be a means of evaluating REITs as compared to price-to-earnings (P/E) for equities. This is a result of the fact that REITs are pass-through entities and are required to pay out 90% of their net income in dividends. This allows them to avoid paying taxes and is why they retain very little earnings.
In our list of 7 high yielding stocks, there are four traditional equities and three Equity REITs to consider buying now. The approach to analyzing them will be consistent with the type of equity investment being considered.
1. AT&T Inc (T)
Price: $29.56
Market Cap: $215.25 billion
Business Summary
AT&T Inc. is a holding company that provides communications and digital entertainment services in the United States and the world. The Company operates through four segments: Business Solutions, Entertainment Group, Consumer Mobility and International. The company was formerly known as SBC Communications Inc. and changed its name to AT&T Inc. in November 2005. AT&T Inc. was founded in 1983 and is based in Dallas, Texas.
Dividends
Forward Annual Dividend Yield: 6.88%
Dividend Payout Ratio: 71%
5-Year Average Dividend Yield: 5.36%
3-Year Dividend Growth Rate: 2.1%
Years of Consecutive Increases: 34
T is considered a Dividend Aristocrat for a reason since it’s had a long history of paying a dividend and posting annual increases to the dividend. Currently, T pays out 71% of its income in dividends. That is below the 13-year median value of 81%. The current yield is higher than the 5-year average yield of 5.36% and is above the 13-year median yield of 5.41%. The current yield is only slightly below the highest trailing annual yield over that period of 7.17%.
Valuation
Price-to-Earnings (P/E): 5.60
Price-to-Book (P/B): 1.17
Enterprise Value to EBITDA (EV/EBITDA): 6.47
T is trading near its 10-year low P/E value of 5.51 and below its current industry median P/E of 19.33. Over the past 13 years it has had a median P/E of 14.41. The P/B value ratio of 1.17 is close to its 10-yrar low of 1.12, is below the 13-year median value of 1.75 and below its current industry median value of 2.07. Its current EV/EBITDA of 6.47 is slightly below its 13-year median value of 7.00 and is below the current industry median of 8.29. From a valuation perspective, T is trading near historic lows in several measures.
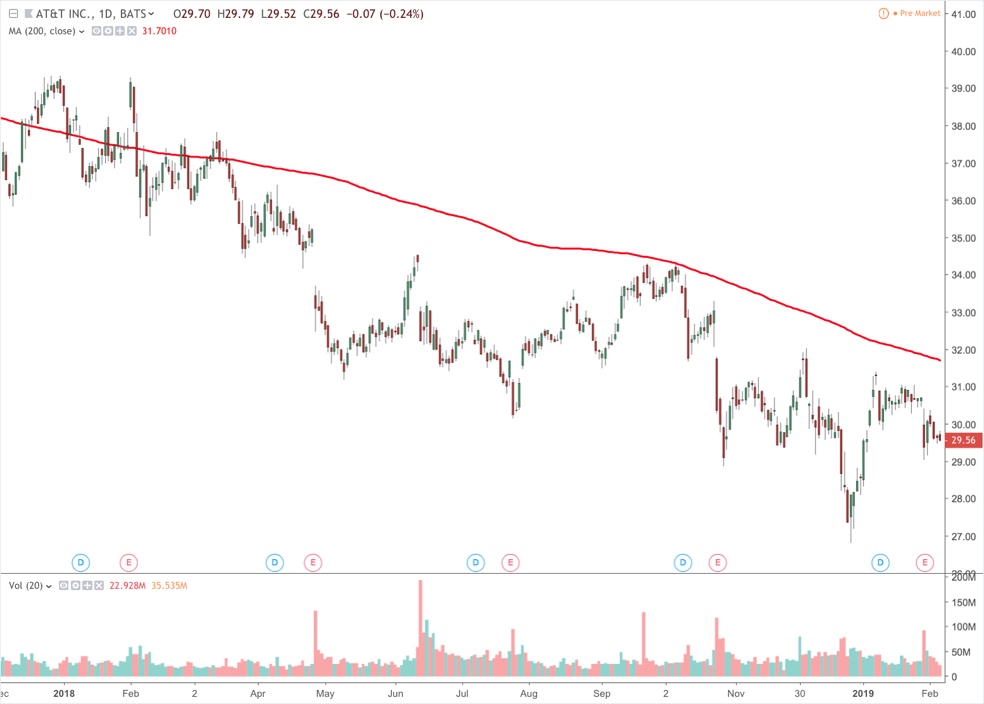
Price History
52-Week High: $37.81
52-Week Low: $26.80
52-Week Change: -16.70%
200-Day Moving Average: $31.36
The price of T is trading about 10% off of its 52-week low and just below its 200-day moving average. While it has underperformed the S&P 500 over that period, the low price is contributing to the relatively high historic yield and the low valuation.
2. Invesco Ltd. (IVZ)
Price:$18.58
Market Cap:$7.64 billion
Business Summary
Invesco Ltd. (Invesco) is an independent investment management company. The Company provides a range of investment capabilities and outcomes, which are delivered through a set of investment vehicles, to help clients achieve their investment objectives. It has a presence in the retail and institutional markets within the investment management industry in North America; Europe, Middle East and Africa (EMEA), and Asia-Pacific. Invesco Ltd. was founded in December 1935 and is based in Atlanta, Georgia with an additional office in Hamilton, Bermuda.
Dividends
Forward Annual Dividend Yield: 6.40%
Dividend Payout Ratio: 56%
5-Year Average Dividend Yield: 3.47%
3-Year Dividend Growth Rate: 5.7%
Years of Consecutive Increases: 10
The current dividend yield of 6.40% is well above the 13-year median of 2.48% and its 5-year average yield of 3.47%. The payout ratio of 56% is above the 13-year median value of 43% but is in line with its current industry median value of 56%. The 3-year dividend growth rate of 5.7% is close to its 13-year average of 6.00% and is above its industry median value of 5.20%. IVZ is currently paying a historically high dividend and based on its payout ratio it appears like they should be able to sustain the dividend and its historical growth rate.
Valuation
Price-to-Earnings (P/E): 8.68
Price-to-Book (P/B): 0.85
Enterprise Value to EBITDA (EV/EBITDA): 9.43
IVZ is trading near its 13-year low P/E of 5.61 and considerably below its median value over that period of 15.79. The current industry median P/E is 14.21. It is also currently trading below book value at 0.85, which isn’t abnormal for financial stocks. The 13-year low P/B is 0.56 and the median value over that period is 1.48. IVZ has a current P/B ratio that is below the industry median of 1.04 as well. The 13-year median value for EV/EBITDA is 12.3, which is higher than its current value of 9.43. Its current EV/EBITDA is also below the industry median value of 11.05. From a valuation perspective, IVZ is trading at a value both compared to its own history but also compared to its industry.
Price History
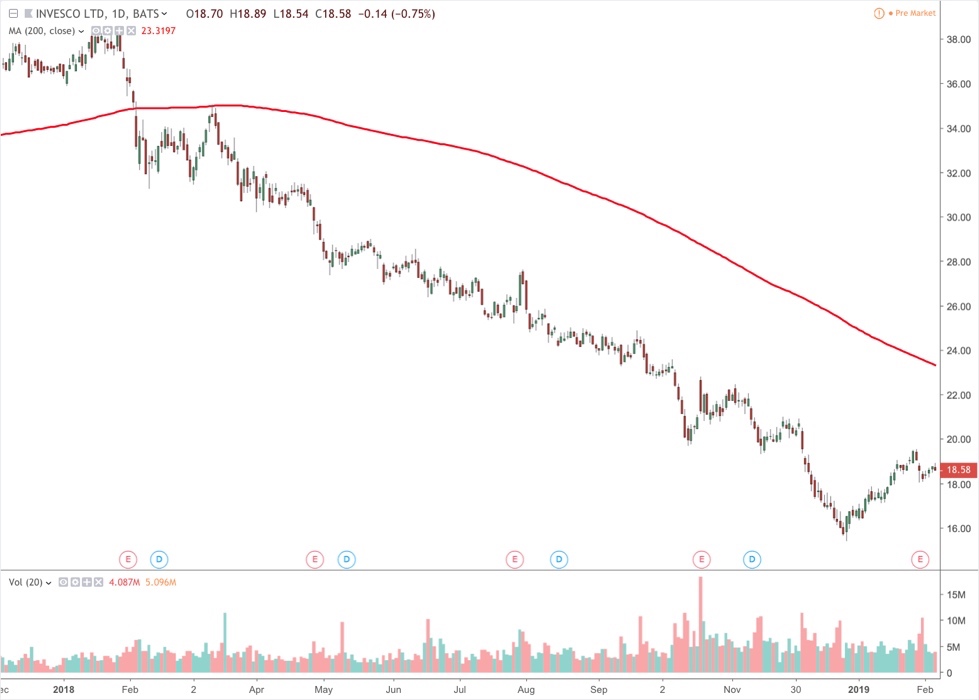
52-Week High: $35.03
52-Week Low: $15.38
52-Week Change: -41.35%
200-Day Moving Average: $21.32
IVZ is down considerably over the past year and is currently trading below its 200-day moving average. This has contributed to its historically high dividend yield that it’s currently paying and valuation. The relatively low payout ratio and free cash flows indicate that, despite the price weakness, they are capable of maintaining their dividend.
3. The Buckle Inc (BKE)
Price: $17.3
Market Cap: $836.9 million
Business Summary
The Buckle, Inc. is a retailer of casual apparel, footwear and accessories for young men and women. As of January 28, 2017, the Company operated 467 retail stores in 44 states throughout the United States under the names Buckle and The Buckle. The Company markets a selection of brand name casual apparel, including denims, other casual bottoms, tops, sportswear, outerwear, accessories and footwear. The company was formerly known as Mills Clothing, Inc. and changed its name to The Buckle, Inc. in April 1991. The Buckle, Inc. was founded in 1948 and is headquartered in Kearney, Nebraska.
Dividends
Forward Annual Dividend Yield: 5.61%
Dividend Payout Ratio: 51%
5-Year Average Dividend Yield: 3.61%
3-Year Dividend Growth Rate: 4%
Years of Consecutive Increases: 0
The current dividend yield for BKE is well above its 5-year average yield of 3.61% and its 13-year median yield of 2.3%. It’s also considerably higher than its industry median value of 2.29%. The payout ratio is relatively high historically for BKE as its 13-year median value of 29%, but by itself wouldn’t be considered high. BKE also pays a special dividend every January, which has ranged between $0.75 to $1.75 over the past three years. Since beginning to pay a regular dividend in 2016, BKE hasn’t raised its dividend and may be using the special dividend as a means of passing on a portion of the company’s profits each year to investors.
Valuation
Price-to-Earnings (P/E): 8.74
Price-to-Book (P/B): 2.05
Enterprise Value to EBITDA (EV/EBITDA): 3.93
The 13-year median value for the P/E of BKE is 12.86. That is considerably higher than the current value of 8.74, which is near its 13-year low of 7.57. The P/E is also below the industry median of 19.95. The current P/B ratio of 2.05 is well below the 13-year median value of 4.29 but is a little higher than the industry median of 1.63. The current EV/EBITDA is below its 13-year median of 6.5 and lower than the industry median of 11.82. For most of these measures, BKE is a little above its 13-year low and represents a compelling valuation.
Price History
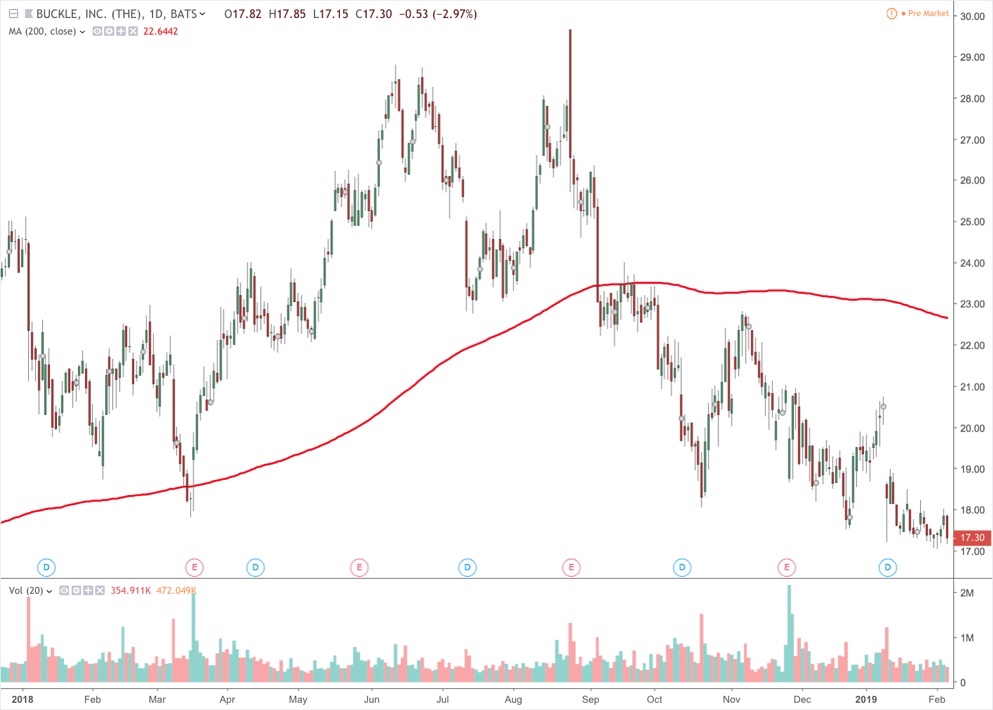
52-Week High: $29.65
52-Week Low: $17.03
52-Week Change: -15.10%
200-Day Moving Average: $21.42
The price of BKE is trading near its 1-year low and is below its 200-day moving average. Since mid-October the price has stabilized and the large $1.25 dividend in January contributed to the large decline as the price was adjusted lower to account for the dividend.
4. B&G Foods (BGS)
Price: $25.72
Market Cap: $1.7 billion
Business Summary
B&G Foods, Inc. (B&G Foods) is a holding company. The Company manufactures, sells and distributes a portfolio of shelf-stable and frozen foods across the United States, Canada and Puerto Rico. The company was formerly known as B&G Foods Holdings Corp. and changed its name to B&G Foods, Inc. in October 2004. B&G Foods, Inc. was founded in 1996 and is headquartered in Parsippany, New Jersey.
Dividends
Forward Annual Dividend Yield: 7.31%
Dividend Payout Ratio: 66%
5-Year Average Dividend Yield: 4.81%
3-Year Dividend Growth Rate: 11%
Years of Consecutive Increases: 8
The median yield for BGS over the past 13-years is 4.46%, which is considerably lower than the current yield of 7.31%. BGS is higher than its 5-year average yield and its current median yield for the industry of 2.06%. Over the past 13 years the Payout ratio has been at 107%, which means that the company has historically paid out more in dividends than they generated in net income. The current payout ratio of 66% is much more respectable and near the 13-year low of 57%. In the last 10 years, BGS has gotten more consistent about raising its dividend and has a high 3-year growth rate of 11%. That is in line with its 10-year average growth rate.
Valuation
Price-to-Earnings (P/E): 8.97
Price-to-Book (P/B): 2.01
Enterprise Value to EBITDA (EV/EBITDA): 14.56
The current P/E of 8.97 is just off of its 13-year low of 7.39 and considerably lower than its median value of 25.60 over that period. It’s also significantly lower than its industry median of 19.86. The current P/B ratio is slightly higher than the industry median but is below its 13-year median value of 3.70. The current EV/EBITDA is in line with its 13-year average of 14.00 and has remained near this level since early 2012. The valuation ratios for BGS are in line with historical averages and below the industry in some categories. The fact that it’s not comaparatively over valued and pays a historically high yield adds to the value of owning this stock.
Price History
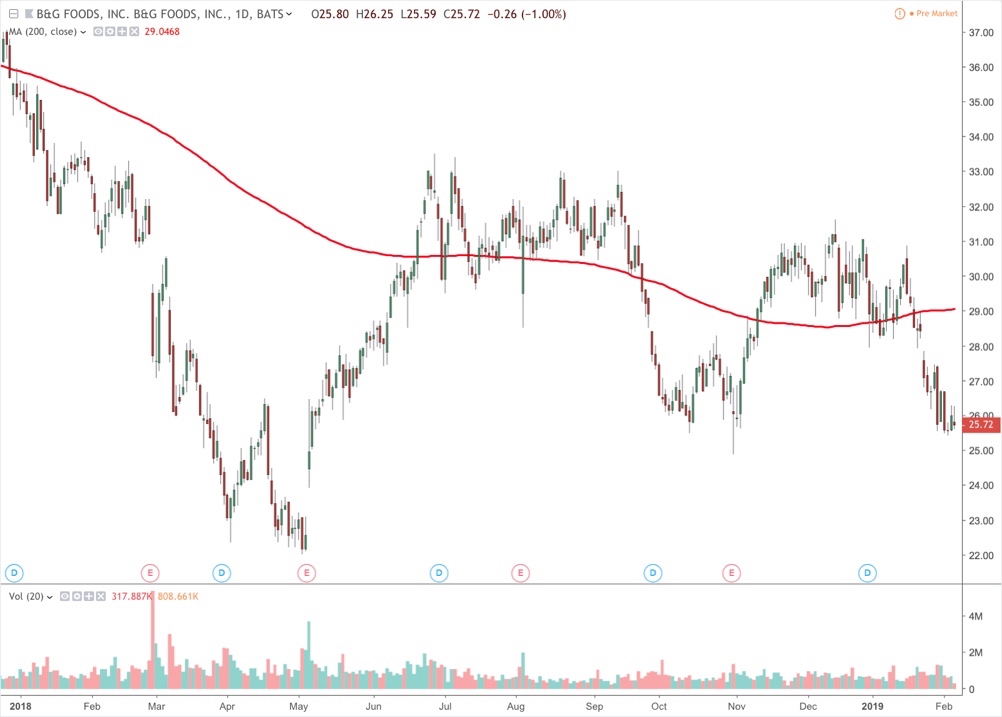
52-Week High: $37.81
52-Week Low: $26.80
52-Week Change: -16.70%
200-Day Moving Average: $31.36
The 52-week low was established on BGS in May of last year and showed some resilience during the sell-off in late 2018. It recently slipped below its 200-day moving average and is trading near its October 2018 low.
5. Kimco Realty Corp (KIM)
Price: $17.10
Market Cap: $7.34 billion
Business Summary
Kimco Realty Corporation is a self-administered real estate investment trust. The Company is engaged in the ownership, management, development and operation of open-air shopping centers, which are anchored generally by discount department stores, grocery stores or drugstores. Publicly traded on the NYSE since 1991, and included in the S&P 500 Index, the company has specialized in shopping center acquisitions, development and management for more than 60 years.
Dividends & Valuation
Forward Annual Dividend Yield: 6.43%
FFO Payout Ratio: 82.35%
5-Year Average Dividend Yield: 4.73%
3-Year Dividend Growth Rate: 6%
Years of Consecutive Increases: 9
Price-to-FFO (P/FFO): 11.59
Price-to-AFFO (P/AFFO): 11.66
The current yield for KIM is above the 13-year median yield of 4.01% and above the 5-year average yield of 4.73%. For REITs, funds from operations (FFO) and adjusted funds from operations (AFFO) are better measures when looking at the payout ratio. For KIM the FFO payout ratio is 82.35%, which is an indication that they are generating sufficient cash from their operations to pay their dividend. They have raised their dividend for the past 9 years and has generated a solid dividend growth rate of 6%.
From a valuation standpoint, the P/FFO and P/AFFO are at reasonable levels with values of 11.59 and 11.66 respectively. Those values indicate that is will take the company 11 years to make the current market price of its shares. Comparatively, this is at one of the lowest points for these valuation ratios in the past 7years. The combination of a stable and rising dividend and low valuations makes this stock fairly attractively priced while generating a high amount of income.
Price History
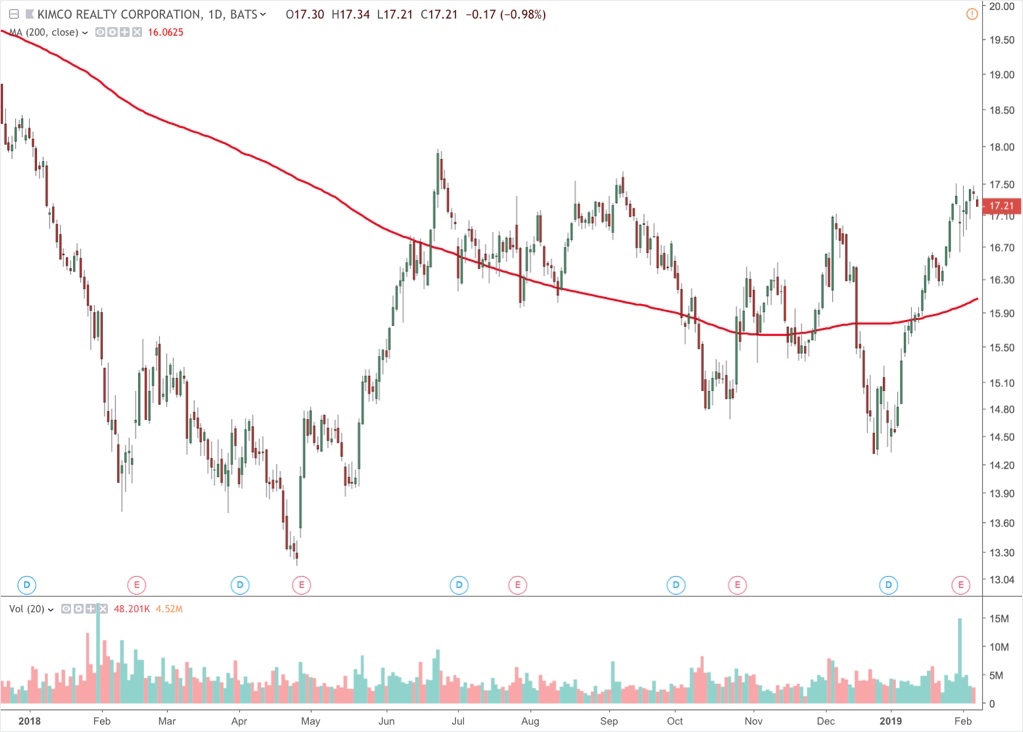
52-Week High: $17.96
52-Week Low: $13.16
52-Week Change: 24.41%
200-Day Moving Average: $16.21
The price is just off of its 52-week high of $17.96 and has traded in a fairly stable range for the past year. Recently the price has risen from a December low of $14.29 and is trading above the 200-day moving average which has also begun to turn higher.
6. One Liberty Properties (OLP)
Price: $27.83
Market Cap: $539.56 million
Business Summary
One Liberty Properties, Inc. is a self-administered and self-managed real estate investment trust (REIT). The Company acquires, owns and manages a geographically diversified portfolio consisting of retail, industrial, flex, and health and fitness properties. One Liberty is a self-administered and self-managed real estate investment trust incorporated in Maryland in 1982.
Dividends & Valuation
Forward Annual Dividend Yield: 6.47%
FFO Payout Ratio: 93.75%
5-Year Average Dividend Yield: 6.9%
3-Year Dividend Growth Rate: 5.1%
Years of Consecutive Increases: 6
Price-to-FFO (P/FFO): 13.98
Price-to-AFFO (P/AFFO): 13.07
The 13-year median yield is 7.04%, which is slightly higher than the current dividend yield. This is representative of a company that has continued to perform relatively well since 2009 and is near its 52-week high in mid-August. The high annual growth rate of the dividend at 5.1% has allowed the yield to remain historically competitive. The FFO payout ratio is indicative of a company that is generating sufficient cash to pay its dividend.
The P/FFO and P/AFFO has remained relatively stable since 2013 as the price has been range-bound and the cash from operations has increased. Similar to KIM, the combination of a stable and rising dividend and stable valuations makes this stock fairly attractively priced while generating a high amount of income.
Price History
52-Week High: $29.44
52-Week Low: $21.70
52-Week Change: 24.24 %
200-Day Moving Average: $26.73
The current price has rallied strongly in the last month as is has once again crossed the 200-day moving average. The price is less than 10% off of its 52-week high and up over 205 in the last year. The long-term trend has continued to rise as indicated by the rising 200-day moving average.
7. Macerich Co. (MAC)
Price: $42.83
Market Cap: $6.49 billion
Business Summary
The Macerich Company is a self-administered and self-managed real estate investment trust (REIT). The Company is involved in the acquisition, ownership, development, redevelopment, management, and leasing of regional shopping centers located throughout the United States.
Dividends & Valuation
Forward Annual Dividend Yield: 7.01%
FFO Payout Ratio: 74.75%
5-Year Average Dividend Yield: 4.11%
3-Year Dividend Growth Rate: 4.6%
Years of Consecutive Increases: 8
Price-to-FFO (P/FFO): 13.98
The current dividend yield for MAC is considerably higher than the 5-year average and the 13-year median yield of 4.11% and 4.08% respectively. The FFO payout ratio of 74.75% shows that they are only paying out that amount of the cash they’re generating from operations. That is attractive since it shows the ability to pay their dividend and still have room to increase it. MAC has consistently raised their dividend over the past 8 consecutive years with a solid growth rate of 4.6%.
As the price has come down the past couple years, the P/FFO is becoming increasingly more compelling. The current value of 13.98 is near the lowest point it has traded since 2010 and the high relative dividend yield reflects that point. The combination of lower valuation, historically high yield and consistent growth rate makes this an attractive candidate for dividend income.
Price History
52-Week High: $61.91
52-Week Low: $40.90
52-Week Change: -25.45 %
200-Day Moving Average: $51.64
The price has come down significantly over the past year and is near its 52-week low and well below its 200-day moving average. As the price comes down, the dividend yield increases and is allowing the dividend yield to attain historically high levels. The price has yet to fully stabilize and has gapped lower on its most recent earnings announcement.