Stock market strategies

Volatility Could Be the Best Trade in the Markets Right Now

The yield curve inverted and that led to a scramble among analysts to forecast the implications. The most obvious implication is that the yield curve typically inverts prior to a recession. That seems to be well known and is now widely covered in the financial media.

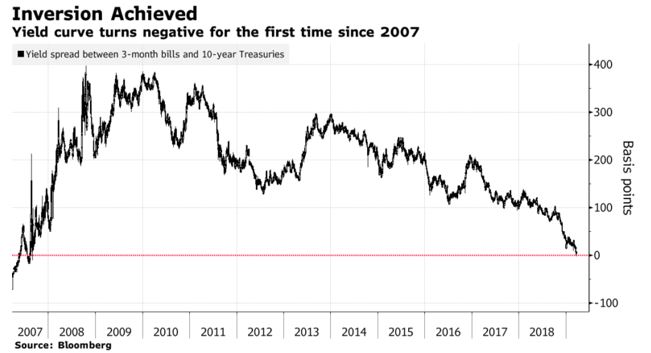
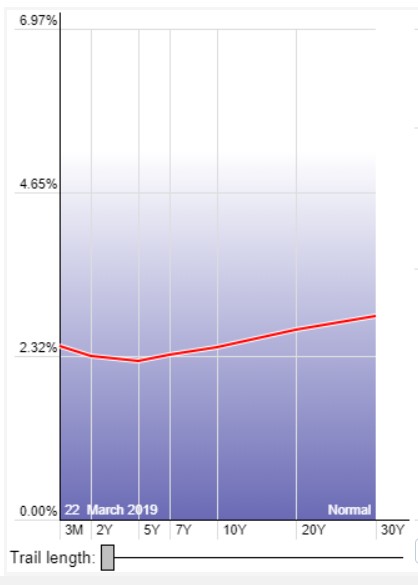
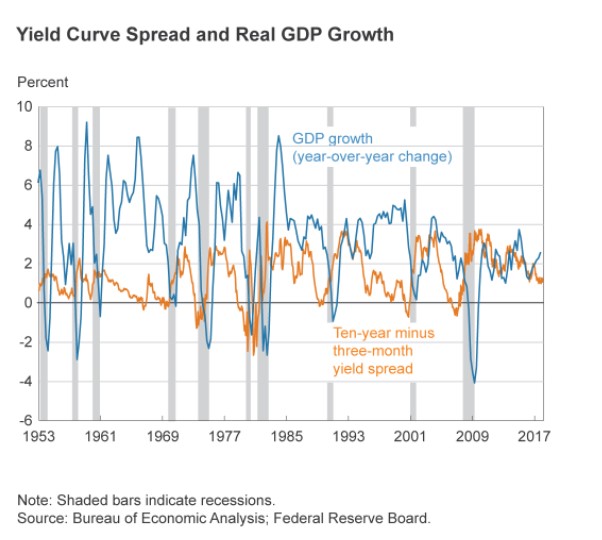
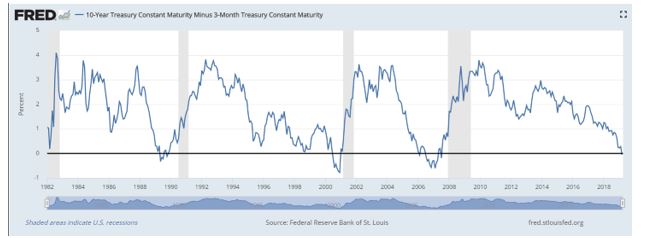
The relationship between an inverted yield curve and recessions can be seen in the chart below.

federal reserve chart

Source: Federal Reserve

The chart shows the difference in interest rates between the 10 year Treasury note and the 3 month Treasury bill. This is one way of looking at the yield curve which measures the differences between interest rates of varying lengths.

When the yield curve is normal, the value of this interest rate spread is above zero which indicates that the rate on ten year Treasuries exceeds the rate on three month Treasuries. This is what we’d expect since longer term loans generally carry higher interest rates.

The dark horizontal line in the chart above marks zero. Moves below zero have been followed by recessions which are shown as the vertical grey bars on the chart.

More Than a Recession Indicator

A research note from Alan Ruskin, global macro strategist at Deutsche Bank, according to MarketWatch.com notes the relationship between the yield curve and the volatility of the stock market.

Riskin said,

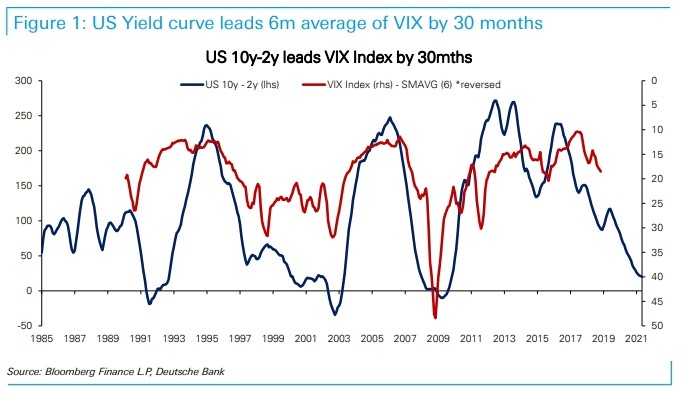
“Fear not, ‘the vol cavalry’ are finally coming. Who says so? The yield curve,” he said, in a [recent] note. It ends up that the yield curve is very strongly correlated with all the usual measures of stress, including the VIX, the Cboe Volatility Index, an options-based measure that illustrates expected S&P 500 volatility over the coming 30-day period (see chart below).

expected S&P 500 volatility over the coming 30-day period

Source: MarketWatch.com

It also correlates with other volatility measures, like Deutsche Bank’s own gauge of realized forex volatility, and the MOVE index, which measures bond-market volatility. Ruskin said it also tracks well with measures of financial conditions like the Corporate BAA-U.S. Treasury 10-year credit spread.

“In all cases, the message is fairly simple — the ‘vol cavalry’ are indeed coming, but they have had a long ride in, for the yield curve typically leads the…vol measures by close to three years,” he said.

 Indeed, the typical lag between the 10-year/2-year yield curve and the VIX is 33 months, while bond and currency volatility lag by 36 and 40 months, respectively.

For those that view volatility as synonymous with trading opportunities, those long lags aren’t as worrisome as they may sound, Ruskin said. He noted that the curve has been trending flatter since 2014.

That means “we should already be ‘over the hump’ whereby the curve is increasingly associated with a pickup in vol.”

The VIX has been near a level of 15 recently, less than half the level reached in late December when the VIX closed as high as 36.07.

The current readings are below the VIX’s long term average which is over 19.

Sound Reasoning For the Relationship

MarketWatch asked, “So why does a flatter curve portend volatility? It’s because flattening tends to lead growth slowdowns, which are themselves associated with an increase in volatility.

“In this way, rather than attributing direct causation, it could be that the yield curve is a good leading indicator of the growth cycle, and it is growth that may be more directly causing/influencing volatility,” Ruskin said.

“In this instance, the yield curve predicts a slowdown, and the slowdown breaks the normal recovery phase, and that this break from stability creates the market stress.”

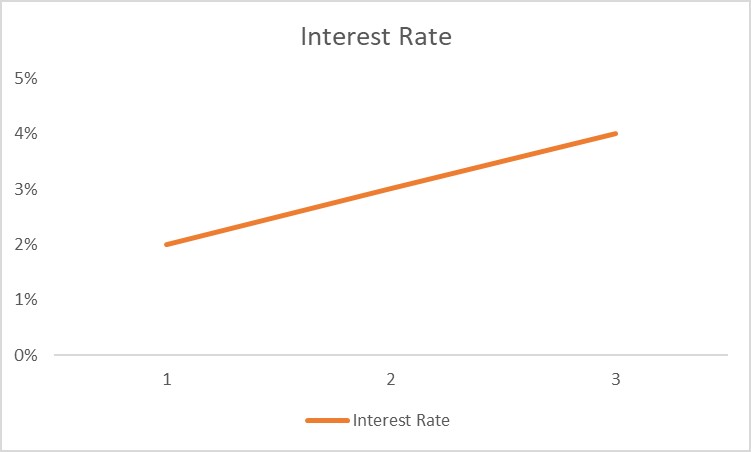
Of course, it’s possible that the currency cycle is different. Interest rates across major economies remain extremely low, which means that adjustments in policy rates will be modest, limiting the potential for big moves in rate spreads, which are the “bread and butter” of currency volatility.

Other policy measures, including the Bank of Japan’s yield-curve control program are a “direct attack” on bond volatility, he said.

At the same time, constraints on central banks’ rate policy and the limited degree of freedom that gives policy makers scope to respond to economic events can also be a source of volatility, he said, which should be encouraging for riskier assets like equities and emerging market assets and currencies.”

Trading the VIX

While VIX itself is not directly tradable, iPath S&P 500 VIX Short-Term Futures ETN (NYSE: VXX) does show a high correlation to the index and could be used to trade this idea.

VXX is an Exchange Traded Note (ETN). An ETN is similar to an ETF. It can be bought and sold just like a stock and has low trading costs. The difference between the two is that an ETF owns stocks while an ETN owns derivatives, adding another level of risk to the investment.

A derivative is a trading instrument that is based on something else. It will always have an expiration date. On that date, the contract will spell out settlement terms. An option on a stock is an example of a derivative. At expiration, the settlement calls for delivery of stock if the option is above or below a certain price. Otherwise, the contract is worthless.

Underlying holdings consist of futures contracts on the VIX. These are exchange trade futures and are therefore as free from default risk as possible for a derivative. That makes VXX an ideal choice for conservative investors seeking a volatility trade.

VXX itself is volatile.

VXXB chart

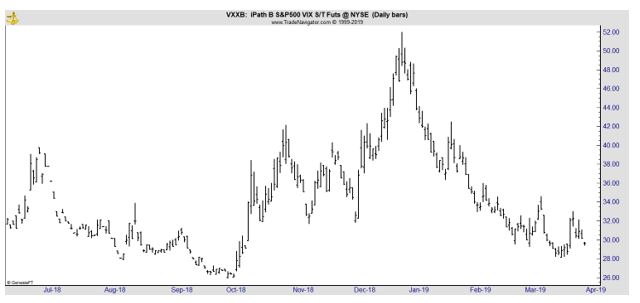
If there is an increase in volatility the ETN should be expected to move higher. That could deliver gains to investors. Because of the risk, investors might want to consider using options on VXX.

A call option on VXX could move higher if the price of the ETN rallies. However, the risk is limited to whatever the investor pays to open the trade. Call options are generally available for less than 10% of the price of the underlying security and will lead to risks of just a few hundred dollars, or less, to potentially benefit from the price move of 100 shares.

While calls might not be right for all investors, they could be the most risk averse trade for investors seeking to gain exposure to volatility as an asset.


Stock market strategies

Know What You Want Your Investments To Do

Successful musicians often suffer from financial problems that are similar to the problems of a typical individual investor. The similarities could be surprising given the fact that successful musicians can earn millions of dollars in their career.

Despite the fact they earn so much money, the cause of a successful musician’s problems could be the same as any other investor’s problems. They may simply fail to understand what they want their investments to do.

In this article, we are focusing on investments. There are other financial problems that affect individuals and successful musicians, like overspending or under saving, and we are not addressing those.

Know Your Goals

No matter how much money you make or how much you invest, it’s important to have clear goals. Don McLean estimates that he’s earned about $150 million in his career. Much of that could be due to the song “American Pie.” It’s ranked by many experts as one of the greatest songs of all time.

McLean recently talked to MarketWatch.com and discussed his attitude towards money. It could be important to note that McLean has a degree in finance that he earned in 1968. This could make his experience unusual since he is knowledgeable in the field.

His experience and knowledge were obvious in the interview. According to the interviewer, at one point, he said, “I want to ask you something. In a relatively short time, the stock market has gone from like 18000 to 25000. Don’t people think that’s a little strange? It’s shocking.”

His skepticism of the stock market affects his investment strategy. McClean’s goal is to earn a return of 6% a year on his money. This allows him to focus on safety and he reports that he mostly owns bonds along with just two stocks.

In addition to his own education, McClean referenced a former business agent who said, ‘Don’t ever invest in anything that you don’t like and understand.’ If you enjoy it and understand it and analytically it is a good investment, that’s a great thing. Then your money’s doing something that is pleasant for you. It’s not just a number.

That could explain the two stocks he owns, Alphabet, parent of Google (Nasdaq: GOOGL) and Amazon (Nasdaq: AMZN). McLean likes their dominant market positions, “and I plan to hold those because they are the government, as far as I can see. I’ll probably add to those as we go along.”

Google is an interesting stock. It is one of the rare stocks that made its all time low when it went public. The stock has delivered exceptional returns to investors since it began trading in 2004.

GOOGL chart

Now, it is a giant company that is one of the components of every day life for many people around the world. The same can be said for Amazon, but its stock price has been more volatile.

AMZN monthly chart

Amazon began trading in 1997 and survived the internet crash however investors have endured significant volatility in the more than two decades since the stock went public.

In recent years, Google and Amazon have become safer in many ways than the companies were 15 years ago.

McLean emphasized the importance of safety, “What I was trying to do was not lose the money that I had worked hard for. Back in the ‘70s I had a lot of 5 and 6 and 7% governments and of course as rates came down I made money.

Then, we hit 2008 and it was just a mess and I took everything I had out of governments and invested them all in corporate bonds. Really good companies. And that paid off like crazy.”

He is always on the look out for historic opportunities like that, offering an insight from his younger days,

“When I grew up, gold was $35 an ounce and pegged to the dollar. Everything was slow and steady. Government bonds under President Carter, if you went out 30 years you could get like 20%! Do you remember that? Imagine getting 20%, locking that in for 30 years? I’d do that in a minute.”

Now, he adds, “Some of my money is still in corporates and some is now in preferred stocks and so I get a little protection against the market and also benefits from the market. And that’s worked nicely. I try to get, like, a 6% return if I can — 5 or 6%. That’s enough for me.”

He’s not looking for quick gains, noting, “You know it’s just: slow and steady. That’s how I like it. I bought some properties — at one point I had four homes.

I sold one and I’m going to sell another and then I’ll have two — one on each coast, that are just incomparable, so I will never sell them. And they’ve gone up a lot. I don’t lend money, and I don’t borrow money. That’s another thing. I don’t have any debts.”

Lessons For Individual Investors

There are important lessons to draw from this:

  • Know your goals. Individuals earning less than McLean might not be satisfied with 6% returns but know what your goal is.
  • Understand the risks. McLean focuses on avoiding losses and is satisfied with lower returns since the risks outweigh the potential rewards in his mind.
  • Understand what you invest in. If you are a trader, this might mean simply understanding the strategy used to select trades. As a longer term investor, it could be important to understand what the company does.
  • Align your goals with your strategy. McLean is a long term investor focused on income. The goals match the investments. It is important to have a strategy that matches the goals and investments that match your temperament.
  • Be prepared to act when historic opportunities come along.

You may not want to duplicate Don McLean’s strategy or portfolio and that is certainly admirable. You should create your own strategy and portfolio. But you should stick with your own strategy for the long term to achieve the benefit of the plans you make.


Cryptocurrencies

This Study Could Reveal the Best Way to Invest in Crypto

Maybe some investors would like to invest in the crypto markets but find the market itself to be daunting. All told, it’s a market that’s worth more than $140 billion and that 2,134 different coins for investors to choose from according to CoinMarketCap.com.

Bitcoin is perhaps the best known and accounts for about half of the recent market size. The next two largest coins are Ethereum and XRP and both are approximately 10% the market cap. These three could be the most important coins to follow for some investors.

Data Shows Market Correlations

A recent study called Initial coin offerings: Fundamentally different but highly correlated by Antonio Fatás, Beatrice Weder was recently published by the Centre for Economic Policy Research (www.cepr.org).

CEPR was founded in 1983 and is a network of over 700 researchers based mainly in universities throughout Europe, who collaborate through the Centre in research and its dissemination. The Centre’s goal is to promote research excellence and policy relevance in European economics.

CEPR Research Fellows and Affiliates are based in over 237 different institutions in 28 countries (90% in the EU). The organization has made key contributions to a wide range of European and global policy issues for over two decades.

The study looked at initial coin offerings, or ICOs, and concluded, “We should not expect a high correlation between ICO tokens and the price of Bitcoin or Ethereum given that they have very different business cases.

This column demonstrates that this was indeed the case during 2007, but the moment the Bitcoin/Ethereum bubble burst, the correlation with ICOs increased and it remained high even when prices had stabilized.

This may have been because the ICO market is still in its infancy and needs to mature, or it may indicate that ICOs were just one of the children of the hype and are likely to share the fate of major cryptocurrencies.”

Getting to the Current Market Environment

Digging into the paper, the authors noted, “While the Bitcoin hype came under pressure in 2018 as its price collapsed, activity in initial coin offerings (ICOs) still remained significant. Over 1,000 new coins or tokens were created through ICOs in 2018, raising over US$21 billion.

The two largest ICOs (pre-sale) – Telegram and EOS – raised $1.7 billion and $4.2 billion, respectively, and the next largest also raised over $500 million. Investors, aspiring entrepreneurs, and also policymakers and regulators have been paying increasing attention to this new market.

While ICOs typically rely on a similar technology to that used in cryptocurrencies (i.e. blockchain), their purpose is much wider than just facilitating payments. ICOs can be seen as a new funding model for new ventures.

ICOs differ from traditional forms of funding because the founders often do not retain control of the platform after its launch, an attractive feature for those who like the idea of decentralized power.

While many ICOs are in the IT space, there have also been many cases in other industries, ranging from health care, energy, and finance to infrastructure (see Figure 1).

50 largest ICOs

Source: CEPR, calculations based on list of largest ICOs at coinist

ICOs involve two types of tokens: security tokens and utility tokens. Security tokens offer participation in governance and future earnings, and are thus more akin to equity. Regulators have increasingly taken the view that the issuance of such tokens should be subject to the same regulations as securities, implying high regulatory costs. 

To avoid potential regulation, most recent ICOs have involved utility tokens, where no ownership or dividends are granted to token holders. Utility tokens instead promise their holders access to the venture’s future services.

This model works because most of the projects relate to building a platform around a community of users trading certain services (for example, Filecoin is a platform to exchange decentralized electronic storage services).

As a result, the ICO not only raises the funding for the project but also puts into motion the launch of the network of future users. 

While there are potential benefits to ICOs, there are also costs. The creation of separate tokens for services resembles a world in which products and services are priced in their own currency and transactions take place through barter, the equivalent to a modern “Stone Age world of the Flintstones”.

From the point of view of the investor, there can also be concerns about token values. Many early investors are betting on the popularity of the service associated with the token increasing so that the value of the token increases and delivers a return.

But there can be a contradiction here – returns can only be realized when tokens are used, but tokens are only bought by investors speculating on a return.

The final potential risk is that ICOs do not have any inherent economic advantage but are attractive simply because they offer a way of avoiding the regulatory costs related to securities laws and investor protection.

In the worst-case scenario, they allow fraudulent projects to lure in small-time investors. The large number of ICOs that have failed provide support to these concerns.

Because of the novelty of ICOs it is difficult to establish at this stage whether the potential benefits outweigh the risks and costs.

Trading ICOs

To determine how ICOs trade as an asset class, the economists, “study this correlation empirically by collecting data on the pricing of the largest 50 ICOs and test whether the behavior of ICO returns are correlated to the returns of Bitcoin and Ethereum.

If ICOs are truly pricing their unique business models, we would expect their returns to be idiosyncratic with low correlations. If, on the other hand, they are simply seen as an investment vehicle to generate excess returns based on a ‘cryptocurrency bubble’, we would expect them to be highly correlated to prices of the major cryptocurrencies.

We calculate the daily correlation between the daily return of the top 50 ICOSs with the return of Bitcoin and Ethereum using a 30-day rolling window.4 

The results are shown in Figures 2 and 3, where we plot the evolution of the price of the two cryptocurrencies in the same charts to understand whether the correlation has changed over time as the sentiment towards these currencies has changed.

Figure 2 Correlation of daily ICO returns with Bitcoin returns

average correlation of BTC

Figure 3 Correlation of daily ICO returns with Ethereum

average correlation of ETH

Source: CEPR

Correlations remained positive but low while the cryptocurrency phenomenon was taking off and Bitcoin and Ethereum prices were increasing.

However, once the price of the two cryptocurrencies starts falling, correlations increase and reach a very high level, signaling that daily news on the future of Bitcoin and Ethereum seems to be moving the price of all ICO tokens.

It seems that as the ‘cryptocurrency bubble’ bursts, the price-discovery mechanism of ICOs collapses and all their prices just track the value of Bitcoin or Ethereum. 

For traders, this means that in bull markets, investors should trade individual cryptos. In a bear market, the largest coins could be the best place to preserve wealth.


Stock market strategies

It Could Be Time To Buy Into This Big Name Turnaround Story

Some investors love turnarounds. That makes recent price moves in Chipotle Mexican Grill (NYSE: CMG) potentially appealing.

CMG daily chart

It’s been almost four years but many investors, and customers remember the news. Customers fell ill and the stock sold off sharply after a food poisoning outbreak in late 2015. Since then the company has taken numerous steps to restore the brand’s reputation.

The latest quarterly results indicate the efforts could be paying off as revenue is returning to the pre-crisis levels.

Chipotle revenue chart

Source: Standard & Poor’s

Analysts Express Caution

There was quite a bit of good news for shareholders in recent weeks. The stock price crossed above $700 for the first time since 2015. The company reported 6.1% same-restaurant sales in the quarter, with higher prices accounting for 4.1% and transaction growth accounting for 2%.

Stores have made digital ordering easier and begun designing restaurants to make it easier to pick up orders without waiting in line. For drivers, there is even a “Chipotlane,” a new kind of drive-through lane that lets people order ahead.

Chipotle expects its same-restaurant sales to rise in the mid-single digits this year.

Analysts are raising their estimates for the company, according to Barron’s. But, the news service warns. “the latest estimates show the stock trades at 39 times expected 2020 earnings, a remarkable multiple even for a company on the comeback trail.”

Reasons for caution include the fact that “the company has made it more complicated to judge its earnings, because for the past few quarters, it has given investors two different numbers—one that adheres to generally accepted accounting principles, or GAAP, and one that doesn’t.

And the sizable difference between the two is hard not to notice.

The GAAP number wasn’t quite so earthshaking—annual profits rose 2.3% to $6.31 from $6.17. But the company now gives another non-GAAP number that strips out restaurant closing costs and adjusts for items the company considers “corporate restructuring,” including things like accelerated depreciation for some restaurants expected to close.

Using the non-GAAP figures, Chipotle earned $9.06 per share in 2018, a 33% increase from 2017. That kind of growth could presumably justify a multiple of 39 times.

It isn’t unusual for companies to use non-GAAP figures. But Chipotle didn’t release non-GAAP numbers in the same period a year ago, even though it closed or relocated 25 stores in 2017 (versus 54 last year).

In an email to Barron’s, Chipotle CFO Jack Hartung wrote that the company is giving investors more information by reporting both numbers.

“To be clear and transparent, we have reported results both with and without these non-recurring charges, to provide our investors with a clear picture of our underlying results,” he wrote.

The charges “relate to transformation of the company moving the offices and closing underperforming restaurants.”

Wall Street tends to base its expectations off the non-GAAP numbers, though some analysts hope Chipotle’s use of those figures is a temporary change.

“We’re giving them a pass because of the headquarter move to Orange County and the strategic closure of a handful of units,” wrote Wedbush analyst Nick Setyan in an email to Barron’s.

“These one-time expenses should be done by the second quarter of 2019. If they are not done, then it could become a greater concern.”

The non-GAAP numbers aren’t the only reason to be skeptical over Chipotle’s valuation. The company’s restaurant-level margin was up compared with last year, but it fell on a quarter-over-quarter basis.

And some sales gains in the fourth quarter got an extra boost from unique events whose benefits may not last. At the end of the year and the start of 2019, the company offered free delivery, advertising the service on college football bowl game telecasts.

The promotion clearly generated a big response, but it isn’t clear that it will continue to pull in the same number of customers when they have to pay for delivery.

Analysts estimated that the company’s same-restaurant sales jumped about 10% in December, versus about 4% in October and November. Given that the company expects mid-single digit growth next year, it is unlikely it can keep the same momentum for 2019.”

Other Analysts Are Bullish

In a different article, Barron’s offered the bullish case.

“Piper Jaffray analyst Nicole Miller Regan reiterated an Overweight rating on the shares, along with a $725 price target that is the second highest on Wall Street. The latest run-up for the stock started in early February 2018 and has been pulled ahead by an in-process turnaround led by new management.

CMG weekly chart

As upbeat as things might seem today, Wall Street analysts appear less bullish then they were at previous highs, Regan suggested, and if they come around, further share appreciation might be in the offing.

To illustrate: Today, Chipotle stock trades at about 38 times estimated 2021 EPS of $18.69. The Street’s average price target, around $568, is below current prices. Less than 30% of Wall Street ratings are at Buy or equivalents.

At the end of August 2015, when the stock hit an all-time high, the stock was trading at 29 times estimated 2017 EPS of $24.52. But the Street’s average price target was above $700, and the percentage of ratings that were at Buy was closer to half.

Regan praises the management team, which she called “highly collaborative and aligned” in her note. Fourth-quarter earnings came in better-than-expected.

“Operational excellence lays the groundwork for improving guest satisfaction, increasing intent to return and enhancing loyalty,” she wrote.

”Store level efforts are focused on retention, throughput and consistency. Increasing access and awareness is the strategy to identify new guest and target current customers.”

“Despite high expectations, sell-side sentiment and fundamentals are not aligned,” wrote Regan. “We suppose this could always lead to an upgrade cycle as the turnaround continues to unfold, which could benefit the stock down the road.”

The case for the bulls is a strong one as is the case for the bears. It could be best to use a strategy that limits risk, such as one that relies on options and can benefit from whichever scenario you believe is most likely.


Cryptocurrencies

What Is Crypto?

An important question for investors to consider is why they would want to possibly own cryptocurrencies. The question is basically, “what is crypto?” which means is it a hedge against disaster, a speculation, a means of exchange or something else.

Economists at the New York Federal Reserve recently addressed this question, specifically seeking to determine what motivates people to participate in this market.

To find out, the economists included a special set of questions in the May 2018 Survey of Consumer Expectations, a project of the New York Fed’s Center for Microeconomic Data. The survey covers a sample of 1,146 people from ages eighteen to ninety-six, with broad representation by race and gender.

Cryptocurrency Ownership and Demographics 

Eighty-five percent of the survey’s respondents had heard of cryptocurrencies. Around 5 percent of respondents reported that they currently or previously owned cryptocurrency and an additional 15 percent reported that they were considering buying cryptocurrency. 

Actual and potential ownership of cryptocurrencies is concentrated in younger, wealthier demographics. Anecdotal evidence suggests that enthusiasm for cryptocurrency is highest among younger generations.

Consistent with that pattern, the economists found that individuals between 18 and 35 were 13 percent more likely than those over 35 to own or express an interest inbuying a cryptocurrency. Not surprisingly, the young group were more likely, on average, to report greater knowledge about cryptocurrencies, as shown in the chart below. 

knowledge of crypto by ageSource: Federal Reserve Bank of New York

Older individuals were much more likely to cite “not knowing how to buy” cryptocurrencies as a reason for not owning any. This suggests that a lack of knowledge or familiarity with the cryptocurrency market could be an important barrier to entry for older demographics. 

Individuals with an annual income of at least $100,000 are 5 percent more likely to own or express an interest in buying cryptocurrency relative to those with income of less than $100,000.

That means that younger individuals were significantly more likely to report “lack of funds” as a reason to not buy. This suggests that financial constraints may have hindered otherwise enthusiastic members of the younger demographic from participating in cryptocurrency markets. 

Cryptocurrency Is Like…?

To understand people’s views on cryptocurrency, the economists also asked survey respondents what they perceived cryptocurrency to be most similar to, given the following options (multiple answers were allowed, with the exception of “none of the above”): 

  • Gold
  • Traditional money, such as U.S. dollars
  • A new technology
  • Stocks or bonds
  • A lottery ticket
  • None of the above

The dominant view was that cryptocurrency is most similar to “a new technology,” with 47 percent of respondent choosing that option. About 24 percent likened cryptocurrency to stocks or bonds, and 17 percent likened it to traditional money. Only 8 percent viewed cryptocurrency as similar to gold. 

But, those results might be hiding important information about the market.

Individuals who owned cryptocurrency or were interested in buying it were particularly likely to perceive cryptocurrency as being similar to gold (41 percent) and stocks or bonds (39 percent). This suggests that such individuals may think of cryptocurrencies as an investment vehicle.

In addition, 37 percent of respondents within this group likened cryptocurrency to traditional money.

If we think of traditional money as a means of payment, then this distribution of views is consistent with the idea that cryptocurrencies are currently perceived less as a payments mechanism than as an investment, even if they can play both roles. 

By contrast, individuals who viewed cryptocurrency as being akin to a lottery ticket were 12 percent less likely to have owned or considered buying a cryptocurrency than those who viewed cryptocurrency as being similar to one of the other choices.

The gap between the latter group and those who responded “none of the above” was 11 percent, as shown in the chart below. 

crypto participation rate

Source: Federal Reserve Bank of New York

Motives for Owning a Cryptocurrency

The economists also asked survey participants to identify the most important reasons for buying cryptocurrencies, or choosing not to. The most-cited reason for buying was that cryptocurrencies are a “good investment.”

Many buyers also pointed to the anonymity properties of cryptocurrency and their lack of trust in the existing financial system—factors that were mentioned almost the same number of times.

Convenience was not viewed as a reason to buy, perhaps because the majority of cryptocurrencies struggle to be a stable means of payment owing to price volatility, and the fact that cryptocurrencies are not accepted broadly as a means of payment. 

Among respondents who chose not to participate in the cryptocurrency market, the most-cited reason was that cryptocurrencies are a “bad investment”—the opposite of the prevailing view among buyers.

This dichotomy could reflect the speculative nature of cryptocurrency markets and suggests that there are large disagreements between respondent groups about the investment value of cryptocurrencies. 

“Lack of trust” ranked second as a reason not to buy cryptocurrencies, perhaps reflecting their lack of institutional backing. Again, the “buyer” and “nonbuyer” camps are clearly divided on this matter; the former lack trust in the financial system, while the latter lack trust in cryptocurrencies.

Respondents cited a lack of need as the third most significant reason for not buying cryptocurrency, consistent with the fact that cryptocurrencies are little used as a means of payment. 

The issue of trust, or mistrust, appears to be perceived quite differently by the young and old groups. Individuals over thirty-five were much more likely to express distrust of cryptocurrencies relative to the existing financial system. 

older respondents vs. cryptoSource: Federal Reserve Bank of New York

The young group’s more sanguine view of cryptocurrencies could be related to the fact that financial crises appear to have long-lasting “experience effects” that take a greater toll on younger individuals than older ones, both psychologically and financially.

In the wake of the Great Recession, younger cohorts may have less faith in the financial system and more openness to unconventional alternatives. 

To Sum Up

The survey reveals that a very high fraction of respondents are aware of cryptocurrencies and that they hold a wide variety of views on the topic. This is perhaps related to the fact that cryptocurrencies are still a relatively new phenomenon.

As with many new things, younger respondents seem to have a more positive view of cryptocurrencies than their older counterparts. As the technology matures and new applications for cryptocurrencies emerge, it will be interesting to find out how these views change. 

For investors, it all indicates that the future of cryptos could be bullish since demographics seem to favor the technology.


Stock market

Uber, Lyft and Pinterest Could Be Signaling Investors

CNBC is warning that “Euphoric IPO market may be a troubling sign for stocks” and the article notes,

“Billion-dollar private companies are stampeding to go public this spring. But fear, not excitement, may be driving the herd.

After a slow first quarter for public offerings, denim giant Levi Strauss kicked off its debut [in March] with shares popping 31 percent on the New York Stock Exchange.”

The stock did not hold its gains after trading began.

stock gains chart

Source: Yahoo

CNBC continued, “The ride-hailing service Lyft is next up to bat and is expected to hit a $23 billion valuation when it lists on the Nasdaq next week. The social media app Pinterest has moved up its timeline to list, filing its IPO prospectus with the SEC on Friday.

Uber, with a jaw-dropping $120 billion target valuation, is planning to release its filing and kick off an IPO roadshow in April, according to Reuters. Slack and Palantir are also on deck in 2019.

But a re-energized, euphoric IPO market is not necessarily a bullish sign, according to some industry experts. It could indicate private investors in these companies want to cash in their chips.

This month’s excitement traces back to the end of last year. A lot of these companies could have listed in the second half of 2018 but put it off. Then came December, the worst month for stocks since the Great Depression.

Larry McDonald, managing director of ACG Analytics, said Silicon Valley clients he has spoken with behind the scenes regretted not listing before the December dip.

“They should have done these deals all last year, and they put it off,” said McDonald, who is also the editor of the Bear Traps Report. “The beatings that these guys took for not bringing those deals in the third quarter were substantial.”

Beatings mostly took the form of criticism on their risk management, McDonald said. But luckily for the start-ups, comments from the Federal Reserve have saved the day.

The Fed has suggested no rate increases would come this year — after indicating in December that two could take place. The newest stance sent stocks higher, providing a solid backdrop for these companies to now go public.

Many private equity and venture capital investors are now “panicked to just get out,” McDonald said.

Today’s IPOs are essentially, a “very bright private equity crowd desperately hitting a fleeting late cycle bid after missing that bid in Q4 and looking down the barrel of a 20 percent U.S. equity market drawdown,” McDonald said.

Larry Haverty, managing director at LJH Investment Advisors said the first-quarter rush to go public is “greed more than fear.”

“That will keep happening until the lights are turned off,” Haverty told CNBC in a phone interview. “IPO booms almost never end well.”

Based on the over-subscription of Lyft’s IPO and successful Levi’s entry, he said investment bankers are likely looking to rush these deals out the door. Bankers are likely telling clients, “the window is open but this Lyft and Levi Strauss is a period of insanity and we better get in on this.”

“It’s finance 101 — make hay while the sun shines,” Haverty said. “If you’re a tech company looking at selling stock now, there’s no reason on God’s green Earth that you wouldn’t sell it.”

Research Backs the Analysts

In “Using IPOs to Identify Sector Opportunities”, Kevin Lapham, of Ned Davis Research, explained,

The number of initial public offerings (IPOs) is a well-known, long-term indicator that can help confirm peaks and troughs in the stock market. Previous studies documented by Timothy Hayes have explored the relationship between an increase or decrease in the number of initial public offerings and the corresponding peak or valley in the broad market that often follows.

However, there is a lack of available information about the use of IPOs to perform sector analysis. Demonstrating the value of using a narrower perspective, this study will winnow the number of IPOs down to the sector level to provide a new market metric.

The theory behind the success of this indicator is twofold. First, investor sentiment can be gauged by the number of IPOs brought to market. Companies, venture capitalists, and investment banks will not benefit from the issuance of new shares unless there is ample investor interest in such an offering.

In studies by Norman G. Fosback, he stated “Companies sell stock to the public primarily when they need capital for expansion and related purposes. This usually occurs when business prospects are bright

and companies view their stocks as generously priced by the market.”

This can only happen effectively when investor sentiment is bullish and stock prices have been rising. In a 2006 Bloomberg news story, it was reported “Chief executive officers are turning to stock markets for financing now that the Standard & Poor’s 500 Index is near a four-year high.”

Second, the number of IPOs provides a measure of supply and demand. Norman G. Fosback (1985) also stated, “The new source of supply introduced into the market’s supply-demand equation also has the effect of diverting investment funds away from other stocks, thus exerting downward pressure on prices.”

Since stocks in a sector typically move in concert with one another, a number of IPOs within the same sector that begin to falter due to lack of buying interest and excess supply will weigh on all stocks in that sector.”

Among the many examples in the paper is the relationship between the tech sector IPOs and the tech heavy Nasdaq 100 Index.

information technology sector IPOs

Source: Using IPOs to Identify Sector Opportunities

In the chart, the number of IPOs and prices peaked at almost the same time. Lapham noted,

“A clear example of investor exuberance related to a specific market sector is that associated with the

Year 2000 tech bubble. In 1999, this sector outperformed all others with record momentum and an astounding 140% annual return.

An emerging internet/tech industry could not have existed without the huge investor appetite for shares of new issues. This unrestrained enthusiasm drove prices to unforeseen levels, resulting in one of the worst bubbles in decades.

The lower clip in [the chart] illustrates the spike in the number of technology IPOs per month in February 2000 (indicated by a down arrow). The solid line in the upper chart clip represents the NASDAQ-100 Index bubble top (indicated by an up arrow).

This is a unmistakable example of an increase in the number of IPOs correctly forecasting a bearish outcome which was realized after the year 2000. There were also successful sell signals during the early 1980’s.

Among the conclusions of the research are the facts that, “The IPO by Sector Indicator improves on broad market sentiment indicators by providing a more detailed view point of sentiment at the sector level.

This study illustrates that as the number of IPOs peaked in a particular sector, so did the risk that a price zenith was near. Moreover, the lack of IPOs in a sector was a strong indicator of an approaching base in that respective sector.

As demonstrated, even a trading model that relies solely on IPO data itself has historically been profitable.”

Based on recent news, it’s possible the indicator is flashing a warning to investors. There are a number of tech IPOs expected in the next few weeks.

Economy

More Big News From the Bond Market That Investors Must Be Aware Of

Many investors are familiar with the news that the yield curve inverted. The yield curve defines the relationship between Treasury securities.

Bloomberg took a broader view at the news and explained,

“Demand for government bonds gained momentum Wednesday, when U.S. central bank policy makers lowered both their growth projections and their interest-rate outlook. The majority of officials now envisages no hikes this year, down from a median call of two at their December meeting.

Traders took that dovish shift as their cue to dig into positions for a Fed easing cycle, pricing in a cut by the end of 2020 and a one-in-two chance of a reduction as soon as this year.

“It looks like the global slowdown worries have been confirmed and the market is beginning to price in Fed easing, potential recession down the road,” said Kathy Jones, chief fixed-income strategist at Charles Schwab & Co.

“It’s clearly a sign that the market is worried about growth and moving into Treasuries from riskier asset classes.”

inversion chart

Source: Bloomberg

The wave of buying that’s cut the 10-year yield by nearly 20 basis points in the last couple of days has global catalysts, too. Weaker-than-expected European factory data that helped drive benchmark German yields back below zero on Friday also supported the move.

An upended 3-month to 10-year curve is widely favored as an indicator that the economy is within a couple of years of recession. And Friday’s move is an extension of the inversion at the front end of the curve that happened in December. The gap between the 2-year and 10-year yields has also narrowed, to around 11 basis points.

That said, many downplay the curve’s predictive powers. Some argue that technical factors have distorted the curve’s shape and signaling capacity, particularly as crisis-era policy has tethered yields for the past decade. A downturn may be drawing near after what has been close to the longest expansion on record, however the market provides no precision on when it will happen.

While the 3-month to 10-year spread “has a relatively decent track record of predicting recessions, it suffers from a timing problem,” said TD Securities U.S. rates strategist Gennadiy Goldberg. “Its inversion can suggest a recession occurred six months ago or will occur two years from now.”

German Bonds Also Reach a Milestone

Less noticed than the inversion was an event in Germany where yield on 10 year bonds dropped below zero. Bloomberg reported,

“German 10-year bond yields dropped below zero for the first time in more than two years after the nation’s manufacturing sector fell deeper into contraction, compounding fears of an economic slowdown across the euro area.

The securities, seen as some of the safest that investors can buy, have rallied this year as inflation and growth data have disappointed, while the global economic outlook has also worsened. Friday’s move reverberated through to global markets, with the yield on benchmark Treasury notes falling to the lowest in more than a year.

sub-zero

Source: Bloomberg

Bund yields last dropped below zero percent in 2016, when the European Central Bank was still pumping money into the economy and the U.K. voted to leave the European Union.

The slide below the threshold again, following the conclusion of the ECB’s bond purchases and as the Brexit deadline approaches, has led to increased fears of a so-called Japanification of the region, where inflation, growth and yields remain permanently low.

“The breach of zero underlines how the Fed, BOE and ECB have created a carry environment and a hunt for yields that we haven’t seen for years,” said Arne Lohmann Rasmussen, head of fixed-income research at Danske Bank A/S. “It’s the crux of current market sentiment.”

The IHS Markit’s Purchasing Managers’ Index for German manufacturing fell to 44.7, the lowest since 2012 and well below economists’ median forecast of 48.

The data underlines why market expectations for the ECB’s first interest-rate increase since 2011 have been pushed toward the end of 2020, with the Federal Reserve also having put its rate-hiking cycle on hold.

Germany’s 10-year yield fell four basis points to zero percent, the lowest level since October 2016. Equivalent Treasury yields also dropped four basis points to 2.50 percent after touching 2.49 percent, a level not seen since January last year.

Demand for German bonds has also been boosted by political risks, from Brexit to Italian instability. EU leaders have staved off the risk of the U.K. crashing out of the bloc without a deal next Friday but only gave U.K. Prime Minister Theresa May an extra two weeks.

The German data was also followed Friday by a contraction in euro-zone manufacturing. Signs of a weaker economy in Europe and the U.S. or Brexit uncertainty may push bund yields further into negative territory, according to Rabobank.

“On top of the signal sent by the PMI manufacturing data, this comes on the back of dovish central banks,” said Antoine Bouvet, an interest-rate strategist at Mizuho International Plc. “The stars did align for this sort of move.”

What It Could Mean for Investors

This are important developments for investors to consider. There could be a global recession either underway or approaching.

Stock market prices are believed to discount the future which means that current prices reflect conditions that will occur in the future. In other words, if there is a recession in the future, stock prices are likely to fall before the recession even begins.

This is a warning for investors. Now could be the time to become more conservative in a portfolio, taking profits on some positions and allowing cash to build up. If aggressive positions are opened in the portfolio, it could be best to view them as short term trades with relatively close stops.

Options could also be used, perhaps buying long dated put options as insurance against a steep decline. Options carry limited risk and could deliver large gains if there is a significant decline in stocks. This could offset losses in other positions and allow an investor to recover from a potential bear market in less time.


Stock Picks

Shaq Might Just Be the Next Oprah

On the day that the yield curve inverted, one of the biggest winners on Wall Street was a pizza maker. As Barron’s reported,

“Papa John’s stock was heating up on Friday after the pizza company announced that NBA Hall of Famer Shaquille O’Neal will join its board and serve as an ambassador for the brand.”

The stock was up 6.2% on the day the news was released, an especially significant gain on a day when the S&P 500 Index was off by 1.9%.

PZZA daily chart

Barron’s explained the reason for the rally:

“Papa John’s (Nasdaq: PZZA) hopes it’s on the road to recovery after a disastrous run of bad press surrounding its founder, John Schnatter.

The trouble began in the fall of 2017 when Schnatter blamed declining sales on NFL protests. He stepped down as chairman in July after revelations that he used a racial slur in a conference call. Pizza Hut replaced Papa John’s as the NFL’s pizza partner in 2018.

Since then, the company distanced itself from Schnatter and removed his face from its logo and branding. Papa John’s has seen four straight quarters of downward 2019 earnings, earnings per share, and same-store sales revisions.

Activist fund Starboard Value is trying to turn things around. Starboard CEO Jeff Smith was named chairman of Papa John’s. The company is receiving $200 million from Starboard and said $100 million will be invested in the business.

What’s new. Papa John’s announced on Friday that O’Neal will join the board and invest in nine Papa John’s restaurants in Atlanta. He will also serve as a much-needed brand ambassador.

Since retiring from the NBA, O’Neal has become a fixture on TNT’s Inside the NBA post-game show. He’s also appeared in movies, videogames, and commercials.

This isn’t O’Neal’s first dive in the food industry. He owns a Krispy Kreme franchise in Atlanta and previously owned 27 Five Guys franchises. He also owns a fast casual fried chicken restaurant in Las Vegas and a fine dining restaurant in Los Angeles.”

The news service concluded that, “Bringing in O’Neal wont’s magically fix Papa John’s reputation. But it might be a good step.”

There’s a Precedent

Celebrities have invested in companies before. They have even joined the Board of Directors of companies they invest in. The most similar precedent could be Oprah Winfrey’s investment in Weight Watchers International, Inc. (Nasdaq: WTW).

After a recent decline in the stock, CNBC reported, “Winfrey’s original investment, however, is still in the black. She bought 6.4 million shares of Weight Watchers at $6.79 a share in October 2015, worth $43.2 million at the time, according to a Securities and Exchange Commission filing.

She also joined the company’s board of directors.

Last year, Winfrey sold some of her stake in the company. She now holds 5.4 million Weight Watchers shares, according to a January SEC filing.”

The chart below shows how the company has fared since then.

WTW weekly chart

There have been good times and bad since Oprah joined the team and she has received the credit and the blame at times.

One problem is that company is attempting to rebrand. After the latest earnings, according to CNBC,

“Weight Watchers is scrambling to clarify its new name, WW, and mission after a poorly executed rebranding campaign left consumers confused and membership numbers tanking.

The 55-year-old company started using the shorter name last year in an attempt to embrace wellness — a buzzy but vague term intended to promote a healthier lifestyle that would attract and retain customers long after they achieved their target weight.

The message fell flat with consumers. Weight Watchers is now forecasting a 10 percent drop in membership during the first quarter, the crucial diet season after the holidays that can make or break a diet companies’ entire year, the company said in releasing its fourth-quarter earnings…

Shares plunged by roughly 35 percent [on the news], erasing more than $48 million from Oprah Winfrey’s stake in the weight loss company.”

Analysts noted that,

While Winfrey is a powerful asset, the company’s reliance on her celebrity status also presents a risk.

“One of the bear criticisms for the stock is that Oprah is the whole reason for the company’s success,” Bolton Weiser said. “If they’re now saying they’re tying their whole advertising to her, doesn’t that fuel worries about the day Oprah decides not to be involved?”

Meanwhile, the company’s started adding back references to its former self after abruptly replacing the Weight Watchers name with WW in marketing materials in September. Its website and social media accounts now say: “WW. Weight Watchers reimagined.”

Branding expert Laura Ries said she was “stunned and shocked” when Weight Watchers changed its name last year. It’s never a good idea to switch to initials, “especially when no one uses the initials,” she said.

Oppenheimer analyst Brian Nagel said he wishes Weight Watchers would’ve made its changes last spring so they could’ve had more time to refine their messaging ahead of the key diet season.

Grossman said the company created new television and digital ads featuring testimonials from customers geared specifically to lapsed members. However, the new WW campaign failed to bring lapsed members back into the program, a key demographic the company relies on.”

That has all weighed on the stock according to CNBC:

“It’s gone from being a high flying growth company to being a beaten up kind of turnaround situation,” said Linda Bolton Weiser, an analyst at D.A. Davidson & Co.

Weight Watchers did not respond to requests for comment.

CEO Mindy Grossman told analysts Tuesday the company stands behind its strategy, blaming the results on a poorly executed marketing campaign. It’s now turning to Winfrey to help turn things around.

“If I was going to assess what the [problem] was, it wasn’t granular enough,” Grossman told analysts on a call Tuesday. “I think it needed to be more weight loss-focused, especially in the January season, and a more aggressive bridge from Weight Watchers to WW it needs to be more overt.”

Weight Watchers strayed too far from its core weight-loss mission too fast. Grossman assured analysts the company has already started massaging its message and will launch the new ad campaign with Winfrey this spring.

That’s not a bullish signal for PZZA.  The stock has been in a down trend for some time.

PZZA weekly chart

Shaq might help the company and could be part of its advertising. He does serve as a spokesman for several products and is widely recognized as engaging and entertaining. That could help PZZA recover but investors might want to see confirmation that the company has reversed course before diving in.


Economy

The Fed Might Have Triggered a Bear Market

Last week’s news from the Federal Reserve was significant. After a two day meeting, the Federal Open Market Committee announced that no rate hikes are likely in 2019. But there was more as Yahoo Finance reported,

“At the conclusion of its Federal Open Market Committee meeting, the Fed also announced that it will slow the rolloff of its balance sheet in May and then conclude its reduction at the end of September.

In keeping interest rates steady at the current target range of 2.25% to 2.5%, the Fed said said that the labor market “remains strong” but said economic growth has “slowed from its solid rate in the fourth quarter.”

The Fed statement said indicators have pointed to “slower growth” of household spending and business fixed investment.

The decision to hold rates steady was widely expected; fed funds futures headed into the meeting priced in a 98.7% chance of keeping rates where they are.

The FOMC’s summary of economic projections reflected toward revisions across the board as policymakers dampen their expectations for rate hikes in the future.

The “dot plots,” which chart FOMC voters’ estimates for where they feel benchmark interest rates should be in the next three years, had the median dot for 2019 at the current level of 2.25% to 2.5%.

FOMC participants' assessments of monetary policy

Source: Yahoo

That view — that no rate hikes would be appropriate for 2019 — came from an overwhelming majority of participants: 11 out of 17.

For 2020, the median dot sits only 25 basis points above that level, telegraphing that only one rate hike could be in the cards through the end of next year.

Those projections are a significant downward revision from the December FOMC meeting where policymakers raised by 25 basis points and said the economy could absorb “some further gradual increases.” For comparison, the median dots in the December dot plot signaled two rate hikes for 2019 and a third in 2020.

The lower outlook on rates falls in line with the Fed’s slightly lower expectations for GDP growth.

For 2019, the Fed brought down its median projection for GDP growth from 2.3% to 2.1%. The Fed also raised its 2019 median estimate for unemployment from 3.5% to 3.7%.”

Following the Market

Some commentators were surprised the Fed acted this way, worried that they are now following rather than leading the market. MarketWatch noted, “Even for a bond market bracing for an accommodative Federal Reserve, policy makers’ moves on Wednesday were a stunner, raising the specter of recession.

In particular, analysts said bond investors were taken aback by the sharp reduction of interest-rate-hike projections by the Federal Open Market Committee to zero from two back in December, as reflected in the central bank’s “dot plot” — a chart of Fed members’ projections for future rates.

On top of that, the Fed announced plans to end the runoff of its $4 trillion balance sheet in September and downgraded expectations for gross domestic product in 2019 to 2.1% from 2.3%.

Although the central bank held key rates at a range between 2.25% to 2.50%, as expected, the combination of other statements delivered a dovish jolt to fixed-income investors.

“This decision falls firmly on the dovish side of consensus as the about-face from ‘further gradual tightening’ has now reached a complete 180 degrees,” said Ian Lyngen, head of U.S. rates strategy at BMO Capital Markets, in a Wednesday note.

Lyngen said Tuesday’s rally in the bond market was justified by the Fed’s “dovish double-down,” referencing the decision by the FOMC in January to adopt a more patient policy after markets convulsed in late 2018.”

In the stock market, traders seemed to agree and major market averages were lower as the chart of the S&P 500 ETF (NYSE: SPY) shows.

SPY daily chart

After the Fed’s meeting, economists at the New York branch of the Federal Reserve lowered their outlook for the economy,

“The New York Fed Staff Nowcast stands at 1.3% for 2019:Q1 and 1.7% for 2019:Q2. News from this week’s data releases decreased the nowcast for 2019:Q1 by 0.1 percentage point and increased the nowcast for 2019:Q2 by 0.2 percentage point.

A positive surprise from the Philadelphia Fed manufacturing survey drove most of the increase for 2019:Q2, while higher-than-expected inventories accounted for most of the decline for 2019:Q1.”

Fed chart

Source: New York Fed

Analysts agree that the outlook for the economy is weaker,

“Now some on Wall Street are speculating the growth outlook is such that the Powell Fed will have to cut interest rates later this year. Wait, what?

“The Fed’s revised economic projections, which now imply no rate hikes this year, may have been a bit more dovish than most anticipated, but we think their underlying economic forecasts are still too upbeat. We expect economic growth to remain well below trend throughout 2019 which is why we think the Fed’s next move will be to cut interest rates,” says Capital Economics senior U.S. economist Michael Pearce.

“The decision to leave the target for the fed funds rate unchanged at 2.25-2.50% was unanimously expected, but the sharp drop in Treasury yields following the decision suggests investors were surprised by the dovish tone of the accompanying statement and economic projections,” adds Pearce.

“The Fed does not want to get into the business of predicting the outcome of political decisions, at least publicly, but the removal of both 2019 dots suggests to us that they are much more worried about external risks than we believe is justifiable as a base case,” Pantheon Macroeconomics Chief Economist Ian Shepherdson explains.”

Where does all this leave investors? It should leave investors concerned. The Fed is forecasting slow economic growth. Wall Street analysts are forecasting slower earnings growth. This is a potential setup for lower stock prices.

If there is a bear market accompanied by a recession, the probability of a steeper than average decline should be expected. In the past, bear markets during recessions have resulted in price declines averaging more than 30%.

Investors could ignore the events associated with the Fed, but the possible risks are high and the potential gains may not outweigh those risks.


Stock market strategies

The Yield Curve Inversion Could Mean It’s Time to Panic

The yield curve can be a concept that is a challenge to understand for some investors. It might be best to start by defining the yield curve.

If someone asks, “what’s the interest rate?” that question doesn’t mean very much. At any given time, there are rates for car loans, mortgages, savings account and a variety of other uses. There are also different rates within each use depending on the amount of time the rate covers.

The safety of the loan is another factor that is important in determining the interest rate.

For example, think of a car loan. There are often different rates for new cars or used cars. There are different rates for new cars for consumers with different credit scores. There are also different rates for 3 year loans than 5 year loans. There are other factors but that is enough to detail the yield curve.

Let’s limit the problem to rates for a new car with consumers having credit scores between 700 and 725. These consumers will be offered loans for 1 years, 2 years and 3 years. We can plot the interest rates on the vertical axis of a chart and the length of a loan on the horizontal axis. That’s a yield curve.

interest rate chart

In this example, the chart shows the yield curve. Notice that it slopes higher as we increase the length of the loan period. That’s a normal yield curve because risks increase with the length of the loan and lenders will demand higher interest rates to compensate them for those risks.

Investors usually follow the yield curve for Treasuries. These are securities that are issued for periods as short as one month to as long as 30 years. Issued by the US government, Treasury securities are assumed to be free form default risk.

The Shape of the Curve Is an Indicator

The current yield curve is shown in the chart below.

trail length chart

Source: StockCharts.com

Right now, an inverted yield curve can be seen. This is a yield curve where the shorter term yields are higher than the longer term yields, which can be a sign of upcoming recession.

Economists, in addition to stock market analysts have studied the yield curve. In particular, economists at the Cleveland Branch of the Federal Reserve have reviewed the usefulness of the curve as an economic forecasting tool. They note:

“The slope of the yield curve—the difference between the yields on short and long term maturity bonds—has achieved some notoriety as a simple forecaster of economic growth.

The rule of thumb is that an inverted yield curve (short rates above long rates) indicates a recession in about a year, and yield curve inversions have preceded each of the last seven recessions (as defined by the NBER).

One of the recessions predicted by the yield curve was the most recent one. The yield curve inverted in August 2006, a bit more than a year before the current recession started in December 2007. There have been two notable false positives: an inversion in late 1966 and a very flat curve in late 1998.

More generally, a flat curve indicates weak growth and, conversely, a steep curve indicates strong growth. One measure of slope, the spread between ten year Treasury bonds and three month Treasury bills, bears out this relation, particularly when real GDP growth is lagged a year to line up growth with the spread that predicts it.”

The chart below summarizes this relationship.

yield curve spread

Source: Federal Reserve

What This Means for the Stock Market

Economists have found that the shape of the curve is important. This is logical. When the economy is growing, demand for money should increase. This will push interest rates up. We expect rates on a 10 year loan, for example, to be higher than the rate of a 30 day loan. That relationship is the curve.

As demand for money decreases, potential borrowers are signaling that they have fewer investment opportunities. Lower demand leads to a decline in interest rates. The longer term loans should see the greatest decrease in demand and the curve should flatten, or even invert.

To convert this idea into a useful indicator, we could simply subtract the value of short term rates from the value of long term rates. This results in the next chart which subtracts the interest rate on 2 year Treasuries from the interest rate in notes with 10 years to maturity.

10-year Treasury

Source: Federal Reserve

The chart shows that the curve inverted before the 2000 and the 2008 bear markets. The down trend in the curve reflects the slowing economic growth that has characterized the current economic expansion.

In the chart, we can see that the trend in the yield curve is down but we also see that the current level of the difference between long and short term rates is not yet inverted. The inversion exists between 2 year and 5 year maturities.

What to Watch For

Of course, the yield curve will change over if it does invert, that’s a signal to expect a recession. But, for now, different curves are telling different stories.

As Barron’s recently noted, there is currently an inversion between 3 month Treasury bills and the ten year Treasury note. There are other inversions along the 30 year spectrum of the Treasury yield curve.

“Experts are split on which yield curve is the most reliable, but the Fed prefers looking at the curve between the 10-year and three-month Treasuries, which on Friday turned negative, to minus 0.196 percentage points.

While a yield curve inversion has preceded recent recessions, it doesn’t happen immediately, and the lead time has been very inconsistent. Historically, a recession can come anywhere from one to two years after the curve flips upside-down, and the stock market usually continues to gain from the day of the inversion until its cycle peak.

So we’ve got more time to watch.”

That’s all that investors can do for now but it is important that they watch.