This Scary Chart Could Actually Guide Traders Through This Market
Some charts are interesting but, at first glance, they seem like nothing but an interesting coincidence. Among the more popular charts like this are analogue charts. An analogue is defined as “a person or thing seen as comparable to another.”
Some analysts spend a great deal of time preparing these charts. And, at times they make sense. One popular analogue in this market is comparing the action under President Trump to the market action during the administration of President John F. Kennedy.
A Historian Makes the Connection
Now it is important to separate political opinions from market opinions and it is important to read comments that are political in an objective light. We are not trying to stake out a position on either side of the current political debate but we do find value from a trading perspective in considering this information.
About a year ago, MarketWatch.com noted,
“Last summer, Niall Ferguson, British historian and senior fellow at Stanford University, banged out a laundry list of the president’s shortcomings:
- He’s a serial adulterer with medical issues that he keeps hidden from the press.
- He hired a close relative to work in his administration.
- He’s got a back-channel to the Kremlin.
- He’s a disrupter who uses modern media to communicate directly to the public.
- And the prospect of nuclear war under his leadership is more than a little unsettling.
He was talking about JFK, of course. Who else?
So, Ferguson isn’t the only one who has drawn comparisons between Donald Trump and John F. Kennedy. In fact, even Microsoft founder Bill Gates made the claim (sort of) shortly after the election.
Obviously, finding similarities in the two has also been met with plenty of raised eyebrows, including a pair from MarketWatch’s Howard Gold.
But over the weekend, another theory emerged tying them together — and if it plays out, investors will have a rough road ahead of them.
“This market is starting to look very similar to the JFK post-election rally, top and bear market, which eventually bottomed when Khrushchev backed down during the Cuban Missile Crisis,” the blogger behind The Global Macro Monitor wrote.
Our chart of the day is the illustration he drew to bolster his point:
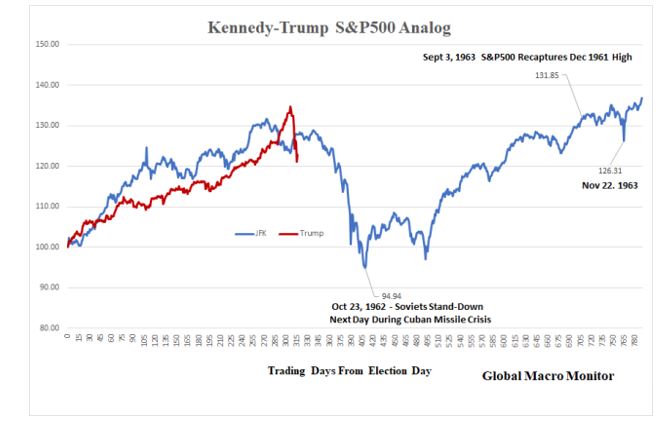
Let’s hope, for investors’ sake, the comparisons end here.”
An Update Contains Bad News and Good News
Recently, this analogue chart was updates and MarketWatch.com noted,
One year after we pointed out uncanny similarities between the market with Donald Trump in the White House and the one under John F. Kennedy, the charts are tracking as closely as ever. That could mean good times ahead for bulls.
But not without some more lumps first.
Back in April, the Global Macro Monitor blog, which was the first to draw the comparison, warned in an update that, if the trend in the chart below were to continue, the S&P 500 would soon take a big hit:
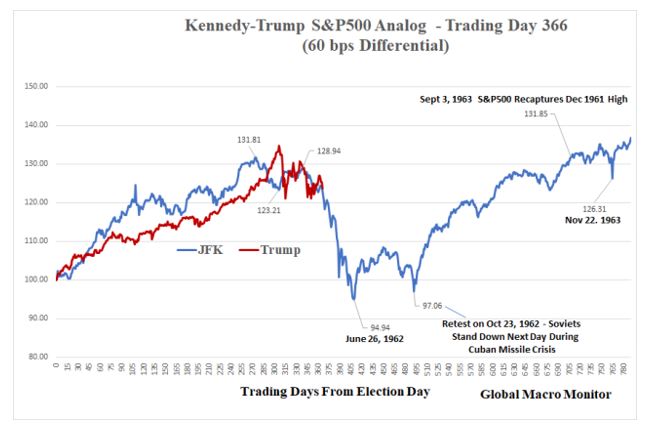
It may have taken a bit longer than expected, but the selling sure came, and the charts are now in lockstep. In fact, Wall Street has taken notice.
In a note shared on the Zero Hedge blog over the weekend, Goldman GS, +0.96% strategist David Kostin chimed in about how the current retreat, driven by policy concerns, mirrors the “Kennedy Slide” of 1962, which came against the backdrop of the Cuban Missile Crisis, when Kennedy demanded Soviet-leader Nikita Khrushchev remove nuclear-missile installations in Cuba.
Here’s Goldman’s zoomed-in version of the analog:
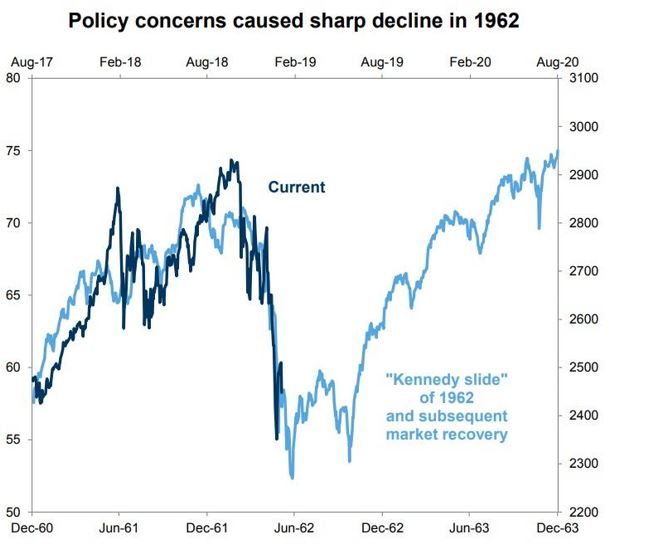
As you can see, if the charts keep tracking, look for the S&P 500 to drop to a low around 2,300 before building a base and rebounding. Goldman’s base target for 2019 is for the S&P to reach 3,000, which mostly aligns with the comparison.
Global Macro Monitor gave several reasons why the analog works, including geopolitical jitters, extreme valuations, inflation woes, etc. But the blogger pointed to one compelling stat, in particular: The S&P’s big move in a short period of time after each election: JFK — 30.1%, 285 days; Trump — 34.8%, 306 days.”
“Bear markets always follow bull markets and the bigger the prior move in a compressed time frame, the harder the fall,” he said. “Bear markets look for catalysts to sell, but the underlying vulnerability remains — valuation and longer-term overbought conditions.”
The Market Could Follow That Analogue
Looking ahead, the analogue calls for a period of consolidation with potentially slightly lower lows followed by a rally. In other words, this is bad news followed by good news. Considering the current environment, the short term outlook could remain bearish.
There is a possibility economic growth will slow down based on the government shutdown. That should be a small impact but it is just another small factor weighing on the economy.
The Federal Reserve’s policy is also weighing on the economy and the stock market as higher interest rates potentially slow speculation and could reduce the amount of large purchases of capital equipment, homes and other items.
Trade wars are also a concern for traders as are a variety of other factors. However, there is the potential for good news.
Over the course of the coming months, it is possible the White House and Congress will find ways to work together. International negotiations could solve trade concerns or at least reach resolve the issues enough to put them in the background for traders.
Traders should have an idea of the likelihood of good news in coming weeks as earnings reports are announced. This could show how serious trade war concerns and political turmoil is for companies.
In addition to news, from a technical perspective, the stock market and many individual stocks are oversold and likely to bounce for at least the short term. This bounce could shift sentiment from bearish to bullish and the bounce could be the beginning of a new trend.
Overall, there is room for optimism and pessimism. But for the most part, traders should be aware of the potential for a turn around which could push stocks back to old highs before the end of the year. This would be, in general, consistent with the analogue that compares the current market to the stock market in the 1960s.
But, then, bad news could come quick. That bounce that began in 1962 ended in 1966 as a 16 year bear market began. But that is years away and traders should focus on the short run rather than the historical analogues that make for interesting speculation.