This Leading indicator Just Screamed a Warning

Analysts tend to divide indicators into various categories. For stock market analysts reviewing economic indicators, categories often include a description of the indicator as either leading, lagging and coincident indicators.
Leading indicators tend to be the most meaningful because they turn ahead of the stock market. The economic data leads the trend in the stock market.
Lagging indicators tend to be useful because they confirm the trend. If leading indicators turn down, for example, and lagging indicators are still moving higher, analysts would expect the worst to be in the future. When leading and lagging indicators are moving together, the trend is well established.
Coincident indicators tend to move with the stock market and they are not usually useful for analysts. This category of indicator tends to be noisy with frequent shifts between up and down trends. In that way, the indicators track the market.
Housing Market Indicators Can Be Important Leading Indicators
The Housing Market Index (HMI) is based on a monthly survey of National Association of Home Builders (NAHB) members designed to take the pulse of the single-family housing market.
The survey asks respondents to rate market conditions for the sale of new homes at the present time and in the next six months as well as the traffic of prospective buyers of new homes.
In technical terms, the HMI is a weighted average of separate diffusion indices for these three key single-family series. The first two series are rated on a scale of Good, Fair and Poor and the last is rated on a scale of High/Very High, Average, and Low/Very Low.
A diffusion index is calculated for each series by applying the formula “(Good-Poor+100)/2” to the present and future sales series and “(High/Very High – Low/Very Low + 100)/2” to the traffic series. Each resulting index is then seasonally adjusted and weighted to produce the HMI.
Based on this calculation, the HMI can range between 0 and 100. The most recent data indicates a slowdown could be near.
HMI Moves Sharply
As CNBC reported:
“Rising mortgage rates and continued home price growth are hurting affordability and fast becoming a toxic cocktail for the nation’s homebuilders.
Sentiment among homebuilders dropped 8 points in November to 60 in the National Association of Home Builders/Wells Fargo Housing Market Index.
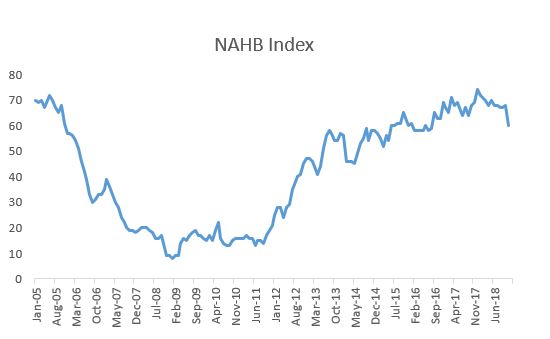
Source: NAHB data
That is the lowest reading since August 2016, but anything above 50 is still considered positive. The index stood at 69 in November of last year and hit a cyclical high of 74 last December.
“Builders report that they continue to see signs of consumer demand for new homes but that customers are taking a pause due to concerns over rising interest rates and home prices,” said NAHB Chairman Randy Noel, a builder from LaPlace, Louisiana.
Of the index’s three components, current sales conditions fell 7 points to 67, sales expectations in the next six months dropped 10 points to 65, and buyer traffic registered an 8-point drop to 45. Buyer traffic had broken out of negative territory earlier this year but now appears to be back in it solidly.
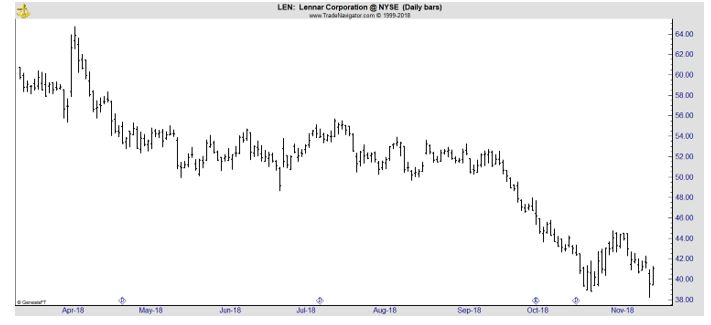
CNBC added, “Some of the nation’s largest publicly traded homebuilders, like Lennar and KB Home, lowered their expectations for sales in 2019 in recent earnings releases. The chart of Lennar is shown below and the stock is in a clear down trend.”
There is still a shortage of homes for sale, but newly built homes come at a price premium, and as interest rates rise, new home buyers are consequently hit hardest.
The average rate on the popular 30-year fixed mortgage is now more than a full percentage point higher than it was a year ago. The huge home price gains seen over the last two years are now shrinking, but prices were still up a strong 5.6 percent year over year in September, according to CoreLogic.
“For the past several years, shortages of labor and lots along with rising regulatory costs have led to a slow recovery in single-family construction,” said the NAHB’s chief economist, Robert Dietz.
“While home price growth accommodated increasing construction costs during this period, rising mortgage interest rates in recent months coupled with the cumulative run-up in pricing has caused housing demand to stall.”
Looking at the three-month moving averages for regional builder sentiment, the Northeast rose 2 points to 58. The Midwest fell 1 point to 57, the South declined 2 points to 68 and the West dropped 3 points to 71.
The turn was rather sudden and year over year changes in the data are now deep into negative territory. The next chart shows the year over year percentage change in the data and confirms the shift in sentiment has been rather sudden.
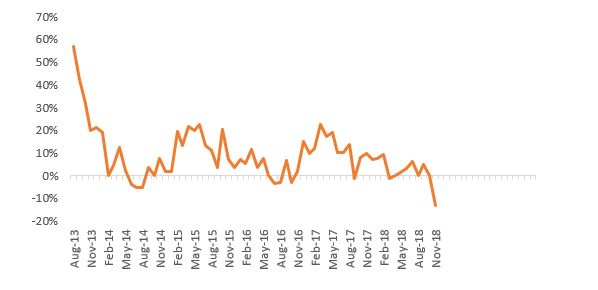
Source: NAHB data
Bearish Implications for the Stock Market
The shift in sentiment indicates builders expect less activity in the coming months. This would mean potentially lower earnings for companies in the sector, as noted above, and it also indicates lower potential earnings for companies in related sectors.
It’s important to remember a home purchase affects a number of other industries. Financial services companies, including banks, mortgage services and title insurers, are involved in sales. Real estate agents depend on sales to fund their office operations.
Homeowners also often purchase new furniture, appliances, lawn equipment, landscape supplies and other goods when they move. This activity all has a significant impact on the economy. A slow down in new homes sales has a bearish implication for the economy.
Slower sales could affect employment in the construction industry and in industries that are involved in the sales of homes. It also affects suppliers of those industries such as appliance makers and furniture manufacturers.
Many of these industries support good paying jobs and any slowdown in the industries could lead to weaker economic data in other economic indicators. Of course, the weakness extends beyond the data and reflects slower economic growth.
Weaker sentiment among home builders may seem like a single story but it is actually warning of potential economic weakness and a potential bear market. Now is a time for investors to pay close attention to other economic data to confirm the potential slowdown, and possibly avoid large losses in stocks.