This Is Why Smart Investors Study History
After the recent selloff in tech stocks, some investors are wondering if it is time to buy the FAANGs. The FAANG stocks are Facebook, Amazon, Apple, Netflix and Alphabet, parent company of Google. They led the market on the way up and have all delivered sharp declines to share holders.
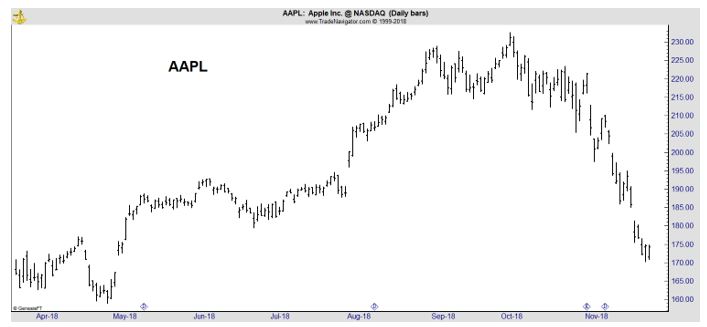
But declines are often viewed as buying opportunities. That is the basis of the investment strategy known as buying the dips which means to enter a stock after it pulls back from its highs. The FAANGs have certainly dipped with losses of 20% or more. Apple is shown below with its 26% decline.
History Favors the Bears
Traders often quote, or at least paraphrase, the European philosopher George Santayana who said, “those who cannot remember the past are condemned to repeat it.” In the stock market, there is a great deal to be learned from a study of the past.
In fact, the FAANG story could be leaving older investors with the feeling that they have seen this story before. In the late 1960s, instead of the FAANGs, investors talked about the Nifty Fifty.
The term Nifty Fifty was an informal designation for fifty popular large-cap stocks on the New York Stock Exchange in the 1960s and 1970s that were widely regarded as solid buy and hold growth stocks, or “Blue-chip” stocks.
These fifty stocks are credited by historians with propelling the bull market of the early 1970s, while their subsequent crash and underperformance through the early 1980s are an example of what may occur following a period during which many investors, influenced by a positive market sentiment, ignore fundamental stock valuation metrics.
Various sources assign different stocks to the group but many agree on many of the names. Lists were published by leading brokers of the day including Morgan Guaranty and Kidder Peabody. One list of the Nifty Fifty stocks is shown below.
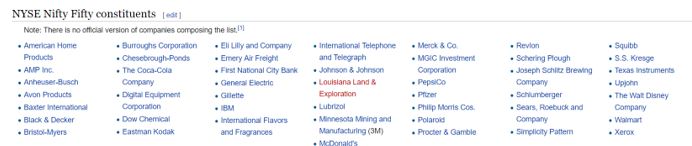
Source: Wikipedia
These stocks delivered great gains for a time but they fell quickly. In The Nifty-Fifty Re-Revisited, a paper by economists Jeff Fesenmaier and Gary Smith, the depth of the decline is easy to see. The authors noted,
“in the memorable words of a Forbes columnist, the Nifty Fifty were taken out and shot one by one. From their 1972–1973 highs to their 1974 lows, Xerox fell 71%, Avon 86%, and Polaroid 91%.”
As a group, the stocks performed relatively well in the long run. The table below shows the performance of different lists updated through 2001. The ratios show the performance relative to the S&P 500 with values above 1 indicating outperformance and valued below 1 showing underperformance.
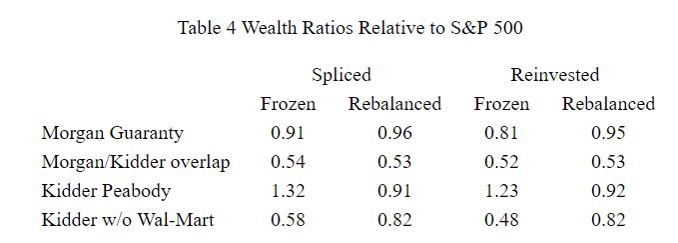
Source: The Nifty-Fifty Re-Revisited
He performance is close, “in comparison to the S&P 500’s 12.01% annualized return over this period, a portfolio of these 50 stocks would have had annualized returns of 11.64% (a frozen portfolio that is initially equally weighted) or 11.85% (rebalanced monthly to be equally weighted).”
But the gains are largely due to the performance of just a few stocks.
Returning to the paper,
“Only ten stocks on the Kidder Peabody list beat the S&P 500, but one did so spectacularly. Wal-Mart’s 26.96% annualized return over this 29-year period was the third highest in the entire CRSP data base.
The only stocks to do better were 28.94% for Southwest Airlines and 29.65% for Boothe Computer, now Robert Half International.
Perhaps, buying a high P/E stock is like buying a lottery ticket: the expected return is not good, but there is a chance of a huge payoff. Here, 80 percent of the Kidder Peabody stocks underperformed the market, but one (yes, one with a P/E above 50) hit the jackpot.”
Looking Ahead
It’s possible the FAANGs will be similar to the Nifty Fifty. That would mean the stocks carry additional down side risks and they should be avoided by bargain hunters. That is the opinion of two analysts recently featured in MarketWatch:
“Canaccord’s Martin Roberge and Guillaume Arseneau noted that [p]ortfolio managers haven’t seen any big hurt when it comes to that group of growthy stocks because year-to-date, some of those tech-focused names are still outperforming the market, they note.
Beaten-down Apple is still up nearly 3% year-to-date, against a 0.3% rise for the S&P.
“We expect the real pain will come when a clear rotation occurs. This rotation should get under way when it becomes clear that earnings growth for FAANGs and other technology names in 2019 do not live up to expectations,” said the Canaccord analysts.
And that second wave of selling should start in January when fourth-quarter results start rolling out, they say.”
The analysts could, of course, be wrong. But it could be best for conservative investors to wait for a few weeks before nibbling on the FAANGs. And then, perhaps Amazon and Netflix should be left for the just the most aggressive investors.
The reason for that is the high P/E ratios of those two stocks. The next table shows the P/E ratios of the FAANG stocks.
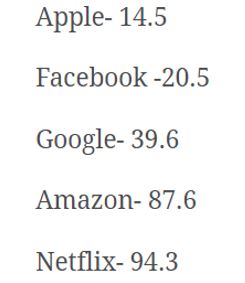
Source: TheIrrelevantInvestor.com
Although Amazon is growing, it is richly priced. The stock market expert Jeremy Siegel has important thoughts to remember on high P/E ratios. Siegel is a Professor of Finance at the Wharton School of the University of Pennsylvania and has studied market history covering hundreds of years.
Siegel noted of the Nifty Fifty, “It was so easy to forget that probably no sizable company could possibly be worth over 50 times normal earnings.” That would apply to Amazon and Netflix for now.
Apple, it could be argued, is reasonably valued and the same could be true for Facebook which dropped more than 40% from its high. But, remember that in the case of the Nifty Fifty, some of the stocks fell more than 90%. A few did deliver strong returns later but few beat the market.
And, that is important for investors to consider at this point. The FAANGs might have a bubble and delivered great gains for a time. But there will probably be new market leaders in the next bull market and it could be best to focus on finding the next FAANGs.