This Could Be the Perfect Trade to Prepare for the Market Correction
In case any investor forgot, prices go both up or down. This was a lesson brought home to investors in the fourth quarter of 2018.
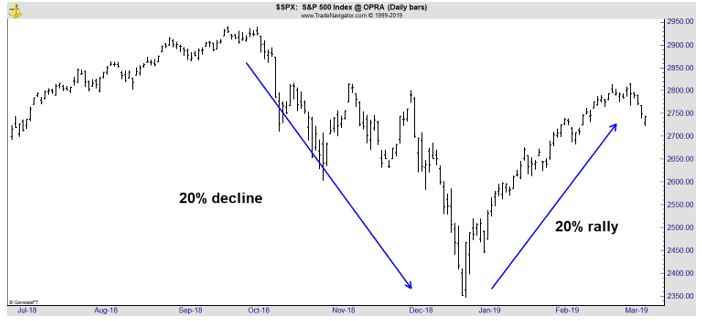
In the fourth quarter, the S&P 500 (shown above) fell slightly more than 20% from high to low. In the first weeks of 2019, the index rallied almost 20%.
Of course, that’s history and the question now could be what comes next.
Overvaluation Could Lead to a Decline
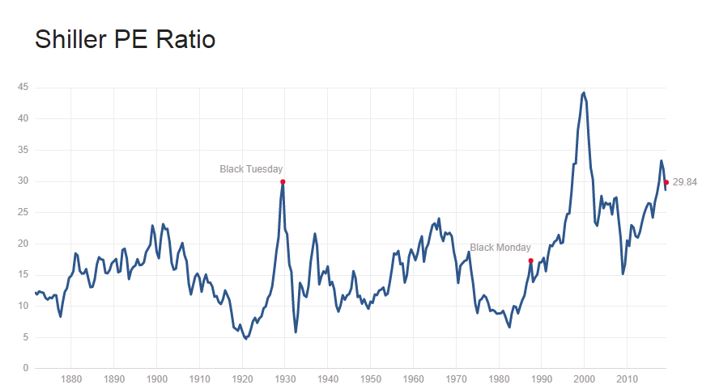
Investors might want to believe the decline has ended but it’s important to remember that many market declines begin when stocks are overvalued. The next chart shows the current state of the market using a popular valuation tool.
Source: cmgwealth.com
This is the Shiller PE ratio which is defined by Investopedia as “a valuation measure, generally applied to broad equity indices, that uses real per-share earnings over a 10-year period.
The P/E 10 ratio uses smoothed real earnings to eliminate the fluctuations in net income caused by variations in profit margins over a typical business cycle. The P/E 10 ratio is also known as the Cyclically Adjusted Price Earnings (CAPE) ratio or the Shiller PE ratio.
The ratio was popularized by Yale University professor Robert Shiller, author of the bestseller “Irrational Exuberance,” who won the Nobel Prize in Economic Sciences in 2013. Shiller attracted a great deal of attention after he warned that the frenetic U.S. stock market rally of the late-1990s would turn out to be a bubble.
The P/E 10 ratio is based on the work of renowned investors Benjamin Graham and David Dodd in their legendary 1934 investment tome “Security Analysis.” They attributed the illogical P/E ratios to temporary and sometimes extreme fluctuations in the business cycle.
To smooth a firm’s earnings over a period of time, Graham and Dodd recommended using a multi-year average of earnings per share (EPS) — such as five, seven or 10 years — when computing P/E ratios.
The P/E 10 ratio is calculated as follows: take the annual EPS of an equity index, such as the S&P 500, for the past 10 years. Adjust these earnings for inflation using the Consumer Price Index (CPI), that is, adjust past earnings to today’s dollars.
Take the average of these real EPS figures over the 10-year period. Divide the current level of the S&P 500 by the 10-year average EPS number to get the P/E 10 ratio or CAPE ratio.”
As the chart above shows, the PE10 moved higher than it was in the 1929 market crash and is at levels seen only during the internet bubble. That episode shows that valuations can remain high for an extended period of time.
But the risk of a decline is elevated when the PE10 is at or near record levels.
Benefit From a Potential Crash
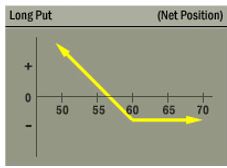
Put options increase in value when prices fall. That makes buying a put one of the best strategies to protect against large losses. While owning a put can be thought of as an insurance policy against a market crash, the low value of VIX means the insurance is available at a low cost.
So, the strategy is to buy a put which brings us to the next decision which involves which put to buy.
There are puts available on SPDR S&P 500 ETF (NYSE: SPY), an ETF that tracks the widely followed S&P 500 index.
Buying a put that benefits from price moves in SPY should help us protect at least some of our portfolio against a bear market. The risks are limited to the amount paid for the option. The profits could be significant if the price of the underlying stock or ETF drops by a large amount.
This idea is summarized in the chart below.
Source: Options Industry Council
SPY was recently trading near $275. We could try to protect 100% of our portfolio but that is expensive. And there is a risk to remember when seeking to buy protection. If the market does not crash or decline significantly before the options expire, the investor could lose 100% of the amount paid to insure the portfolio.
That risk means it might not be practical to avoid the complete risk of loss. But there are strategies that could be useful to limit the down side risk even if the risk is not completely eliminated.
A Trade to Potentially Limit Risks
There are options expiring in September 2019 available. With SPY near $275, a put with a strike price of $246 would limit the risks of a decline of more than 10%.
The September 2019 put with a $246 exercise price is trading at a little less than $5. If the stock market declines below $241, it offers a 1% gain for every 1% decline in price below that level. In other words, this put can offset the risks of a decline greater than 12%.
Buying the September $246 put protects against a market crash until September 20, 2019, the day this option expires.
Since each options contract covers 100 shares, this contract would cost about $500. If the stock market drops by 20%, SPY would be near $219 and this contract would have a value of at least $2,700. That would be a $2,200 increase in value that could offset losses elsewhere in the portfolio.
One of these puts could help protect a $25,000 portfolio against the risk of a market crash for about six months.
A $100,000 portfolio could put crash insurance in place with four contracts. This would cost roughly $2,000, or 2% of the portfolio value.
This is a relatively low cost for insurance. Of course the put can have value if the market doesn’t drop 20% and the put could be worth significantly more if the market falls suddenly shortly after the position is opened.
Right now, the market is offering investors cheap insurance. Buying a put can protect against large losses at a small cost. Buying a put option can also be a strategy that delivers a gain if there is a steep market selloff at any time over the next six months.
Did you know that dividends have rewarded investors for at least 100 years, at least since John D. Rockefeller said, “Do you know the only thing that gives me pleasure? It’s to see my dividends coming in.”
We have prepared a special report about dividends that you can access right here.