This Could Be the First Signal of a Market Bottom
For now, it seems safe to say that the stock market is in a down trend. But the beginning of that trend appeared rather suddenly and caught many analysts and investors off guard. Many had been expecting the up trend to continue.
But the up trend did not continue and now it is time to consider when the down trend will end. Forecasting the reversal of a trend can be difficult to do. Yet it can be profitable for investors to try to forecast the end of the down trend.
Forecasting the reversal doesn’t require the trader to take action. In fact, taking action too soon can be costly. Perhaps the most famous example of calling for the end of a trend too soon is the internet bubble. Many investors saw that stocks were overvalued, but they became more overvalued.
At the time, news reports like the one below from the Guardian, questioned the wisdom of older managers and there were many who wondered whether or not older investors could adapt to the new environment:
“George Soros, the financier and philanthropist who took on the Bank of England and won, has lost $700m (£437m) betting against internet firms – the fledgling titans of the new industrial revolution.
Quantum, the flagship fund of the world’s biggest hedge fund investment group, is suffering its worst ever year after a wrong call that the “internet bubble” was about to burst.
This followed an equally disastrous wager that the euro would be a strong currency.
These losses, during a roaring US bull market, have called into question the management of huge, powerful hedge funds, which use vast amounts of money to speculate on market movements. Tiger, the world’s second biggest hedge fund group, also revealed yesterday that it has lost about $1bn (£625m) since the beginning of the year.
The Soros group of funds has fallen from a peak of $22bn (£13.7bn) last year to $13bn (£8bn) because of bad investment decisions and money withdrawals by nervous investors. Most US stock markets have achieved double digit percentage gains during the same period.”
Of course, Soros recovered. But losses of that size could doom many smaller investors.
Turn to the Charts
Being early in calling for the end of a trend often relies on fundamentals. It could be more helpful for analysts to turn to charts and indicators when looking for trend reversals.
Many traders look for divergences between indicators and prices. A divergence occurs when the indicator, often a momentum indicator, changes the direction of its trend or shows signs of a weakening trend before the reversal in prices.
Traders use momentum indicators like MACD to confirm price trends. Formally, MACD is the Moving Average Convergence-Divergence indicator. It’s been available to traders since at least the 1970s when Gerald Appel began writing about it. The indicator is most commonly viewed as a series of bars, like the ones shown below prices in the charts highlighted below.
If both prices and momentum are rising, they expect momentum to keep pushing prices higher. When momentum slows, they watch for a reversal in the price trend.
A bearish divergence is seen on a chart when prices reach a new short-term high, but a momentum indicator fails to reach a new high. Traders tend to believe that momentum will change directions before price and if momentum weakens, price weakness should follow soon.
The chart below shows an example of a bearish divergence that formed during the internet bubble.
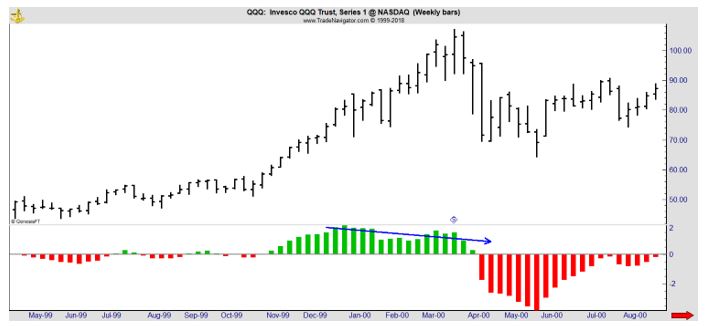
The MAD indicator is at the bottom of the chart and it was reaching a lower high as prices in the Invesco QQQ Trust ETF (Nasdaq: QQQ) were peaking. QQQ is an index that tracks the tech heavy Nasdaq 100 index and was among the biggest winners in the bubble.
The divergence offered the first warning that the trend was about to reverse. At a bottom, investors should be watching for a bullish divergence. The one shown in the next chart was significant and obvious on the chart and signaled the impending end of the bear market in 2009.
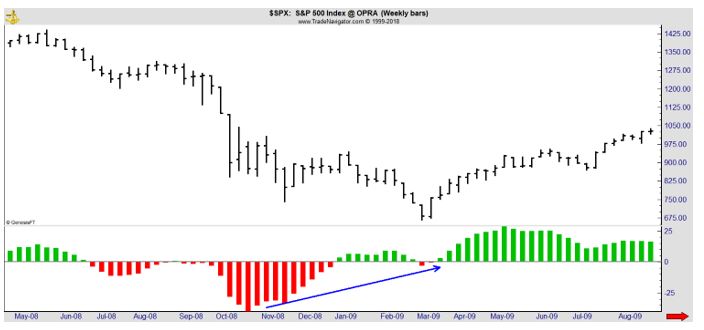
This is a chart of the S&P 500 index. Prices bottomed in March 2009 but MACD was moving higher after recording a significant low in October 2008. That was a signal that the rally that began in march 2009 was important and tradable.
The Current Market
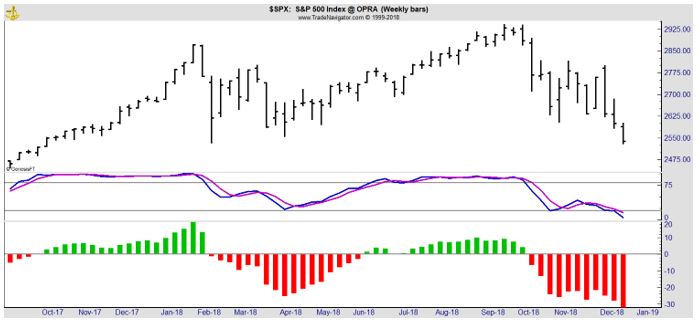
Divergences can be found in other indicators besides MACD. Any momentum indicator could deliver a divergence signal. The chart below shows the current status of MACD and stochastics on the S&P 500.
Stochastics, according to one analyst can be described in simple terms, “Stochastics measures the momentum of price. If you visualize a rocket going up in the air – before it can turn down, it must slow down. Momentum always changes direction before price.”
The same idea applies to a golf ball, which many of us are more familiar with. The gold ball flies off the tee and arcs higher, at least when the pros do it on TV. The ball levels off and as it does its momentum slows. Then, it begins to fall and its momentum accelerates to the downside.
Stochastics, and other momentum indicators, apply this idea to prices. Technical analysts generally believe that a close near the high is bullish and a close near the low is bearish. Stochastics quantifies this belief with the formulas used to find the two lines.
In the chart above, the one of the S&P 500 right now, both stochastics and MACD are driving to new lows. This is consistent with the price action which is also pushing to new lows. The fact that both momentum and price are moving lower indicates that this is a strong trend.
The strong down trend will eventually give way to an up trend. But traders should consider implementing and following their bear market plans as long as the trend remains down. They should also consider letting the market action show that a bottom is in place before turning bullish.
A divergence will highlight the potential end of the down trend. A short series of higher highs will confirm that the trend has most likely reversed. That will be the time to buy aggressively and it appears to be weeks or even months in the future.