Think About Stocks Like a Business

Stock market investors often think about companies in terms of their price-to-earnings (P/E) ratio or other valuation metric. But, if they were looking at their own finances or the purchase of a small business, the P/E ratio might not be the first thing they would consider.
When looking at a small business, the analysis would be more complex.
Earnings Might Not Be the Most Important Factor
Consider the valuation of local small business, perhaps a local manufacturer with $10 million in sales and reported earnings of $10,000. This might sound like a small profit. But, a deeper analysis could reveal a different picture.
You learn that the company is completing a multiyear equipment upgrade, replacing older machines with less expensive, more productive ones. The older ones are being depreciated, resulting in expenses of $2 million a year and new machines cost just $250,000.
The depreciation is lowering taxable income and capital expenditures are fully funded.
The financials also reveal the company paid a large amount of interest in the previous year, but completely paid off its debt. No similar expenses are expected in the future.
You also learn the company is located in a historically underutilized business zone and receives tax credits for that. The company also receives a number of state tax credits. These all lower the tax expense.
Now, the company’s low income seems less important. Instead, you review its cash flow from operations and attempt to understand what its normalized earnings would be, absent all of the unusual expenses and credits.
Cash Flow from Operations Could Be More Important than Earnings
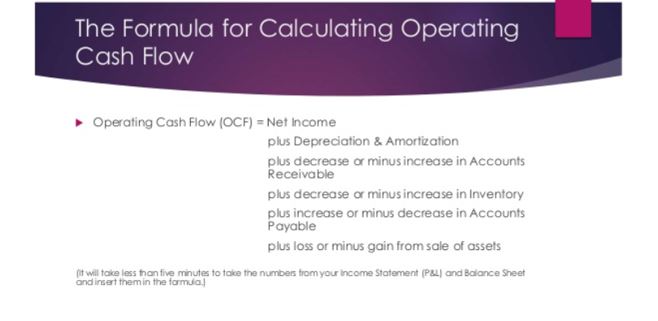
This same analysis could be applied to publicly traded companies. Rather than focusing on earnings, value investors could look at cash flow from operations. This metric is found with the formula shown in the chart below.
Source: SlideShare.net
A value investor will need to dig deeper on the financial statements to determine this metric. Net income and the expense of depreciation and amortization will be found on the income statement.
Changes in inventory, accounts receivables, accounts payables and assets will be on the balance sheet. Many data services will complete the calculations.
Data services obtain the information from the company’s filings with the Securities and Exchange Commission (SEC). The information can also usually be found on the company’s investor relations web site.
This will require a great deal of effort, especially when an investor is considering selecting the best investment opportunity from among several companies. The level of effort may be too intensive for individual investors.
Ignoring Earnings to Screen for Value Investment Opportunities
Value investors can use screening tools to reduce the work required to find potential investment opportunities.
One tool investors use is screening software. Online brokers offer screening tools and there are a number of web sites that allow for rapid screening of opportunities.
To begin the screening process. Investors might want to start with cash flow metrics. Free screening software sites may have limited capabilities, so it may not be possible to search for high cash flow from operations or other specific formulas. However, they should have some cash flow metric available.
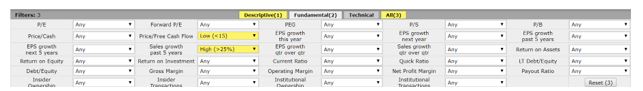
For example, there is a free screening tool available at FinViz.com. The fundamental filters include the price to free cash flow ratio. Other fundamental ratios are also available.
Source: FinViz.com
Free cash flow (FCF) is a measure of a company’s financial performance, calculated as operating cash flow minus capital expenditures. FCF represents the cash that a company is able to generate after spending the money required to maintain or expand its asset base.
The price to FCF ratio is interpreted in the same way other fundamental ratios like the P/E ratio or the price to book (P/B) ratio are. Lower values are often indicative of more value than higher values.
Low fundamental ratios can tip value investors to opportunities. Or, they could be a value trap.
A value trap is a stock that appears to be cheap because the stock has been trading at low valuation metrics such as multiples of earnings, cash flow or book value for an extended time period.
Such a stock attracts investors who are looking for a bargain because they seem inexpensive relative to historical valuation multiples of the stock or relative to the prevailing overall market multiple. The trap springs when investors buy into the company at low prices and the stock continues to languish or drop further.
To reduce the risk of a value trap, the screen above included a second filter requiring sales growth over the past five years to be at least 25%. Rising sales is an indication that the company is delivering products that the consumer demands.
Like all other fundamental indicators, rising sales are not a guarantee of a successful investment. However, combining two or more indicators should increase the probability of a successful investment.
Ignoring Earnings Can Find Value and Growth
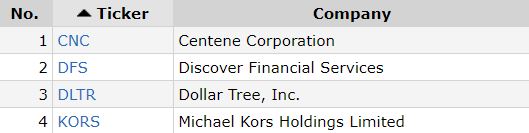
This simple screen shows companies with cash flow from operations, low valuation and increasing sales. To demonstrate the technique, we applied the screen to the stocks in the S&P 500. The four stocks shown below are the only ones that passed the screen.
Source: FinViz.com
The stocks above are all attractive to value investors. Analysts expect each of the stocks to deliver growth in the next five years.
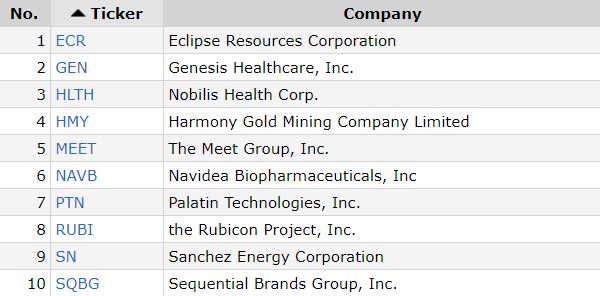
Instead of using companies in the S&P 500 filter, investors could select low priced stocks. A screen for stocks priced under $3 identified 10 potential buy candidates.
Source: FinViz.com
Value investors seeking income could limit the screen to companies paying a dividend or a dividend above some minimum level. There are dozens, if not hundreds, of potential criteria that could be used as a starting point for research.
Screening software is a valuable tool for investors, but it can be easy to abuse this tool. For example, investors should limit the number of criteria they select. Adding too many criteria will limit the trading candidates and risks introducing errors.
Too many criteria results, effectively, to a random list of stocks. Ideally, the criteria should be limited to less than five. This will help increase the value of the investment screening software now available to all investors.