The Fourth Quarter Could Be the Best of the Year

If you ask children about their favorite times of the year, their answers will generally be either their birthday, the summer break from school, Halloween or Christmas. Those might be the most important times of a year in the life of a child.
As we grow older, many of us still place a high value on those times of the year. In everyday living, we expect certain seasonal patterns to unfold every year. In the fourth quarter of the year, we expect Halloween to give way to Thanksgiving and then Christmas.
It’s human nature to expect this level of predictability to be seen in the stock market simply because we like to see some sense of order in the chaos of the market action. The result of this is popular strategies like “sell in May and go away.”
Testing has shown that you can achieve almost all of the market gains and avoid the periods of greatest risk by selling at the beginning of May and staying out of the market for the next six months. That means the time to buy is the beginning of November.
This is just one of the seasonal trading strategies we find in the last three months of the year.
Autumn Crashes Were Once a Logical Part of Life
Seasonal strategies are an effort to make sense based on the calendar out of the chaos of the markets. Many of these strategies were developed by noting that certain events, like market crashes, tend to occur at the same time of the year.
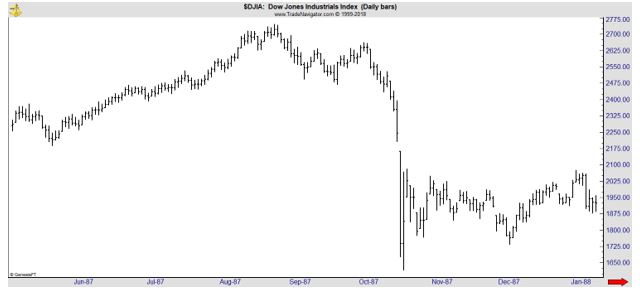
Many investors know about stock market crashes in October 1987 and October 1929. By selling in May, investors avoided these crashes. For those who aren’t familiar with October 1987, the chart is shown below.
But this strategy also avoided the bear market that unfolded in the summer of 1991 and the 36% decline in the panic of 1907 along with steep selloffs in the Panic of 1857 and the Panic of 1837.
Those early crashes were almost predictable. Before the Federal Reserve was created in 1913, panics were fairly common in the fall. Without a central bank, money supply moved across the country in response to demand.
In the fall, demand was usually the greatest in the western states where farmers were bringing in crops. Cash was needed to pay for the crops and the cash was often used to pay off loans to banks which then shipped the cash back east.
With physical cash in short supply in eastern cities, including New York where the stock exchange was located, panics were relatively common in the fall.
There were, of course, other factors and that explains why there were panics in some years and not in others but there was a logical explanation for why selling in May made sense.
But, now those six worst months are nearing an end. In fact, there’s a reason to consider buying before the end of that period.
The Best Quarter for Stocks
One reason to consider being more aggressive in the fourth quarter is the fourth quarter rally, a tendency for stocks to perform best in these three months. Data for the S&P 500 index since 1928 is shown in the chart below.
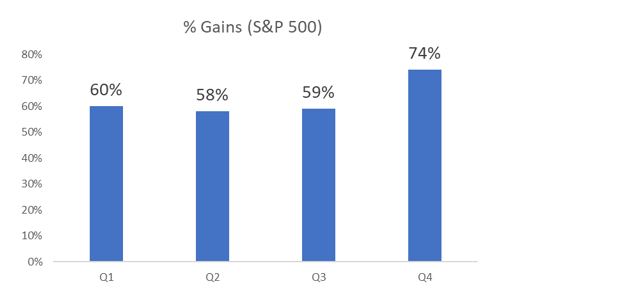
The index shows a gain 74% of the time in the fourth quarter, far better than the results seen in any other quarter.
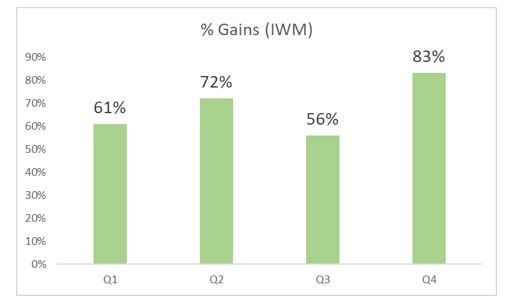
Small caps could be the best trade for the fourth quarter rally. The chart below shows the performance of the IWM ETF by quarter. The results for the fourth quarter are even more consistently profitable than they were in the S&P 500. This chart shows the results since 2000 when the ETF began trading.
Seasonal strategies in the fourth quarter also include a number of short-term trades.
The Santa Claus rally is the name of a strategy that takes advantage of the tendency of stocks to rise in the week between Christmas and New Year’s Day.
Buying and holding stocks for the last five trading days of the year and the first two trading days after New Year’s has been a winner 75% of the time with an average gain of 1.4% for the seven days.
The performance in Christmas week is well above average. In an average week, the stock market shows a gain about 55% of the time and the average gain is less than 0.25%.
Less well known is the “turkey trade.” The S&P 500 gains an average of 0.64% during Thanksgiving week, buying at the open the Monday before Thanksgiving and selling at the close the Friday after the holiday. The trade has been a winner 67% of the time.
Finally, we have a more complex set of trading rules for traders to consider. Studies have shown that stocks setting new 52-week lows in December tend to outperform the market for the first six weeks of the new year.
Stocks making new lows in December could be the stocks investors are selling to generate tax losses. Buying these stocks sets up a potential win when investors buy the stocks back after the 30-day waiting period required by tax rules.
The specific rules for this strategy are to buy stocks making new 52-week lows the Friday before Christmas. If there are too many stocks to buy, select the 5 or 10 stocks with the largest loss over the past year.
Hold these stocks until February 15 and sell at the close that day. On average, this strategy has delivered a gain of more than 12% a year since 1974.
Many traders use seasonal strategies to boost their profits. The strategy can be as simple as tilting to a more aggressive investment posture for the fourth quarter. Small caps could prove to be the best choice for investors this year as they have been many years in the past.
That’s a simple strategy to implement and it could deliver significant gains in the next three months. In fact, some years, the gains in the fourth quarter are equal to or even exceed the gains of the previous none months.