The Conservative Formula That Beats the Market

Investors are often told that risk and reward are inseparable, and it is impossible to have one without the other. Higher potential rewards carry higher than average risks and lower risks require investors to accept lower than average returns.
Recent research shows that this may not be true. In other words, it might be possible to beat the market while lowering downside risks. The strategy for this approach to investing is contained in a paper called “The Conservative Formula: Quantitative Investing Made Easy.”
The paper was written by Pim van Vliet and David Blitz, both of whom work with Robeco Asset Management.
Before digging into the paper, which can be found for free at SSRN.com, we will jump to the bottom line. The conservative formula delivered an average annual return of 15.1% per year since 1929.
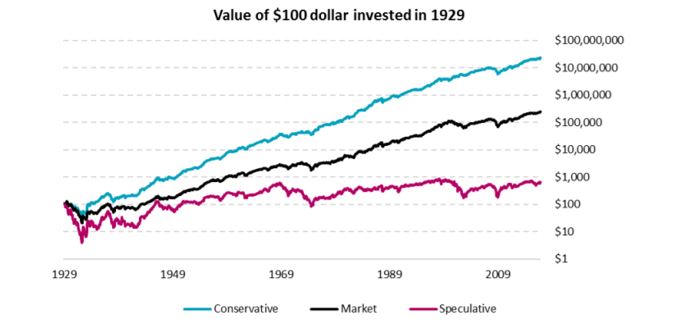
Source: The Conservative Formula
Details of the Formula
The researchers set out to find stocks that met several important criteria:
- Low return volatility.
- High net payout yield.
- Strong price momentum.
Low return volatility is associated with low risk. High net payout yield is a value metric and is designed to find value stocks, Strong price momentum is a factor designed to ensure the stock is going up so that value traps can be avoided.
In short, the formula is identifying low risk value stocks that are in up trends. The abstract explains,
“We propose a conservative investment formula which selects 100 stocks based on three criteria: low return volatility, high net payout yield, and strong price momentum.
We show that this simple formula gives investors full and efficient exposure to the most important factor premiums, and thus effectively summarizes half a century of empirical asset pricing research into one easy to implement investment strategy.
With a compounded annual return of 15.1 percent since 1929, the conservative formula outperforms the market by a wide margin. It reduces downside risk and shows a positive return over every decade.
The formula is also strong in European, Japanese and Emerging stock markets, and beats a wide range of other strategies based on size, value, quality, and momentum combinations.
The formula is designed to be a practically useful tool for a broad range of investors and addresses academic concerns about ‘p-hacking’ by using three simple criteria, which do not even require accounting data.”
That last point indicates the authors tested for statistical robustness to avoid developing a strategy that is optimized on past data and unlikely to hold up in the future. The fact that the strategy worked in the U. S., Europe and Japan also shows its robust nature.
The Process for Implementing the Conservative Formula
The authors focus on large cap stocks in an effort to enhance safety. Larger companies are generally considered safer than small companies because the risks of bankruptcy are lower in large companies with a proven track record of sales over time.
They limit their selection process to the largest 1,000 stocks, sorted by market cap. They then use this list as the starting point for finding potential buys.
The process to find buys followed several steps:
- The list of 1,000 stocks is sorted by volatility over the past 36 months. The highest volatility stocks are ignored and the 500 with the lowest volatility move to the next step.
- Each stock in the low volatility group is ranked on its price momentum. The authors used a momentum measure defined as “12-1 month price momentum” which is commonly used in the academic community. It involves calculating the stock’s performance over the past twelve months with the most recent month’s performance ignored. So, only eleven months of the past twelve month’s data are used (in effect) and the most recent month is excluded.
- Each stock on the lower half of volatility is also sorted by total net payout yield which considers the stock’s dividend yield and any buybacks the company has completed over the past twelve months. Specifically, “this shareholder yield consists of dividend yield and the net change in shares outstanding (calculated as the latest level divided by the 24-month average)”.
- A momentum and net payout rank is assigned to each stock, with 1 being the best value and 500 the lowest.
- The two scores for each stock averaged and the 100 best stocks in the final portfolio are equally weighted.
This process is completed once a year and the portfolio rebalanced at that time. To create a benchmark for comparison, a speculative portfolio is also formed using the same process to select the 100 worst ranked stocks form the 500 high volatility stocks.
Consistent Returns
Given the extended test period, it is possible to see how the strategy performed over different time frames. The chart below shows the results by decade and the authors note that “there is never a lost decade” with negative returns.
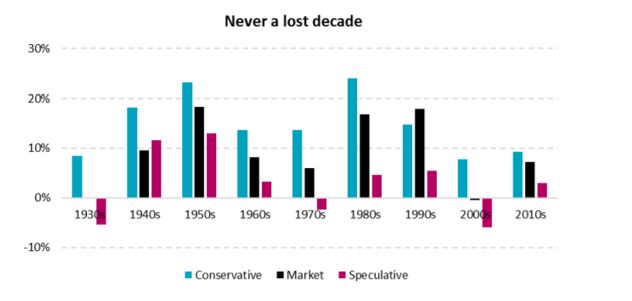
Source: The Conservative Formula
As the chart shows, the conservative formula beat the market in each decade except the 1990s. That is consistent and heartening performance. It is also important to note that the conservative formula performed well in the 2000s when the market lost money.
Now, the question is how could this strategy be implemented by individual investors. The answer lies in finding stocks that meet the criteria even though it won’t be possible to precisely duplicate a strategy that requires owning 100 individual stocks which is beyond the means of many individual investors.
First, the conservative formula focuses on large caps. This is relatively simple for an individual to consider.
Second, the formula focuses on low volatility. Beta or other volatility metrics could be used. Momentum is also relatively easy to measure even if the precise formula is not. And, shareholder yield should be used instead of dividend yield.
Using these criteria, an individual may be able to obtain consistent, and low risk, results. That is worth considering since the market wisdom generally holds these two factors are incompatible. That may be the greatest value of this paper which shows low risk and high returns are possible.