Strategies for Trading Bitcoin and Other Cryptocurrencies
Bitcoin has captured the imagination of traders. And, there is a good reason for that. Many traders have reported large gains from bitcoin and other cryptocurrencies. That has led to interest in the markets and the question of what the markets are.
Cryptocurrencies Are a Market
There are several ways to think about cryptos. Some advocates of the markets insist they are a viable form of money. That means they could be used to complete everyday transactions like buying a cup of coffee. Because there is a degree of anonymity to the markets, cryptos appear to be popular for illicit transactions.
One source estimates “that approximately one-quarter of bitcoin users and one-half of bitcoin transactions are associated with illegal activity. Around $72 billion of illegal activity per year involves bitcoin, which is close to the scale of the US and European markets for illegal drugs.”
Other proponents of crypto argue they are a store of value. This argument can be based on the long term chart of bitcoin shown below.
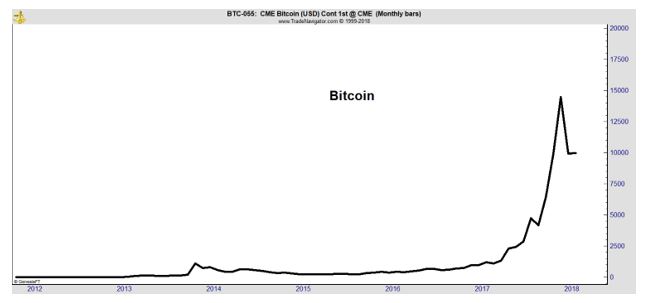
Bitcoin has been volatile but early investors in the market have been rewarded with quadruple digit gains. However, this is a fast moving and volatile market and recent entrants into the market have not been rewarded. In fact, many have losses.
While cryptos might be a form of currency and a store of value, they are also a market. A market is simply where an item is bought and sold. There is no denying crypto is a market.
Technical analysts believe the principles of that field of study can be applied to any freely traded market. They argue prices move in all markets consistent with how traders behave and think. Technicians practice in markets around the world, trading stocks, commodities, currencies and other tradables with the same general principles.
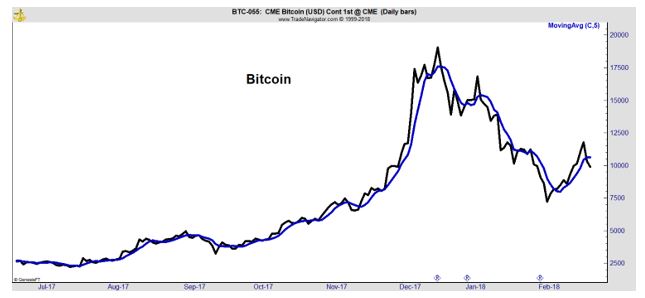
The chart below applies one of those principles, a simple moving average (MA) to bitcoin prices. The chart is indistinguishable from a chart of a stock or commodity. Prices move above below the MA, which is a 5 day MA in this chart.
Moving averages can be used to create a complete trading strategies. The rules are fairly simple but various filters could be added to make the rules more selective or complex. Assuming the simplest form of the strategy, the rules are:
- Buy when the closing price is greater than the moving average. Hold each day that the close remains above the MA.
- Sell when the closing price falls below the MA. Hold cash until the price closes above the MA.
This is a complete trading strategy that could be followed by almost any investor. A moving average is simply the average of the closing prices over the past 5 days in this case, although any number of time periods could be used.
The average is moving because it is recalculated each day with the most recent data. If it is calculated today using the last 5 closing prices, tomorrow it would be updated by dropping the oldest piece of data and using just the five most recent closing prices.
Would a Moving Average Strategy Work on Cryptos?
Traders are skeptical by nature and often back test ideas before trading. A back test simulates the trading rules on data from the past. This is not a perfect solution to the question of whether or not a strategy will work in the future because the future will always differ from the past.
But, the past is the only data we have available to gauge the likelihood of success. As long as the rules are grounded in logic, the past will allow a trader to asses whether or not the rules are likely to be profitable.
Moving averages are logical because they are simply a trend following rule. Prices have a tendency to move in trends. When the prices are above the MA, they are in an up trend. A down trend is defined as times when prices are below the MA.
Test results for bitcoin are shown below. The profit factor is a ratio of profits to losses and value above 1 indicate a strategy is profitable. Moving average lengths from 5 days to 100 days are shown in the horizontal axis.
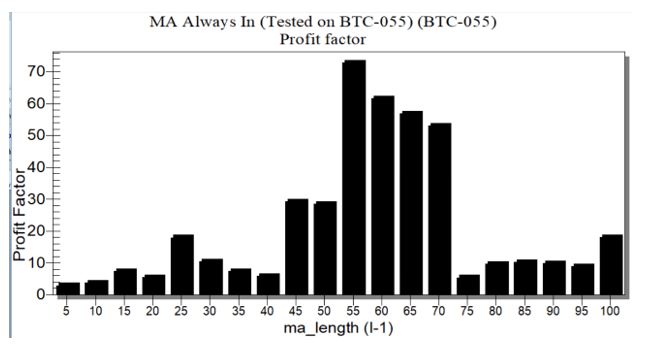
As the chart shows, the strategy was profitable for any of the MAs tested. Values between 45 and 70 days show the largest profit factor and that could be the length of the MA that traders could consider as a starting point in developing their own strategies.
The fact that the strategy is profitable for all MAs is a strong indicator that MAs can be used with cryptos.
But, What If This Is a Bubble?
Some will argue that bitcoin and other cryptos are a bubble. That may very well be true. But, a moving average strategy could help investors avoid the pain of a bubble collapsing as the chart below demonstrates.
Source: SSRN
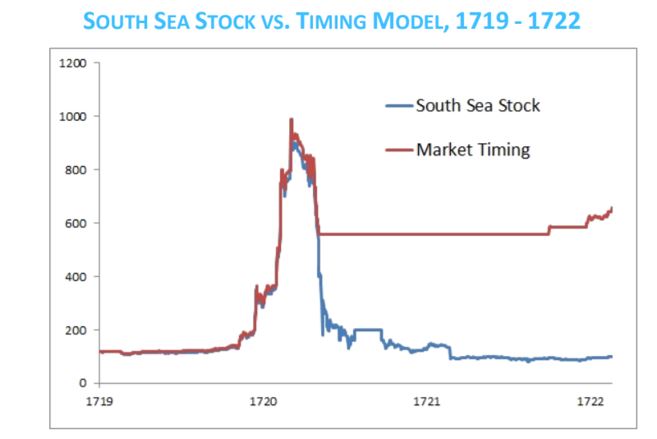
That chart is from a paper titled, “Learning to Love Investment Bubbles: What If Sir Isaac Newton Had Been a Trend Follower?” The chart shows that with a simple market timing strategy, investors could have avoided the large losses that followed the collapse of the South Sea Bubble.
The South Sea Bubble was among the first stock market bubbles. Sir Isaac Newton, the genius who developed the initial principles of calculus and physics, reportedly lost a fortune in the bubble. He invested early, took a quick profit, and then reinvested near the highs after watching with frustration as his friends grew rich.
In the chart above, the red line is the equity of an investor who applied a simple trend following strategy using a 10-month MA. The investor buys and holds when the price is above the MA and sells and holds cash when the price is below the MA.
This simple technique has been shown to work in a number of bubbles through history. It is likely to work in the future, even if bitcoin and cryptos are a bubble. This also demonstrates the value of MAs and shows they could be applied to cryptos as a trading strategy.