Right Now, the Stock Market is Actually Moderately Undervalued
Value investing sounds simple enough. As Warren Buffett and other great practitioners have explained it, the idea is to find assets that are trading for less than their fair value. Buy them at a discount and wait for the discount to disappear at which time they can be sold.
As individual investors know, that description does nothing to provide practical advice. To begin with, we need to define value and that is not done in the general description. Then, we need to know the difference between undervalued and overvalued.
It is possible that a stock will appear to be undervalued using traditional valuation tools but, in reality, the stock will be expensive. The problem is that companies in financial distress will deserve to trade at low valuations, deceptively appearing to be undervalued.
Trying to Solve the Problem Might Have Made Value More Difficult to Understand
Investors have understood the difficulty of value investing for decades and they have attempted to find solutions to the problems. The potential solutions have led to a proliferation of valuation indicators.
Valuation indicators include the popular price to earnings (P/E) ratio. This indicator compares the stock price to the company’s reported earnings per share (EPS). This is perhaps the simplest valuation tool but holds a surprising degree of complexity.
The P/E ratio can be applied to individual stocks or the stock market as a whole. The chart below applies the concept to the market as a whole, showing the P/E ratio for the S&P 500 index.
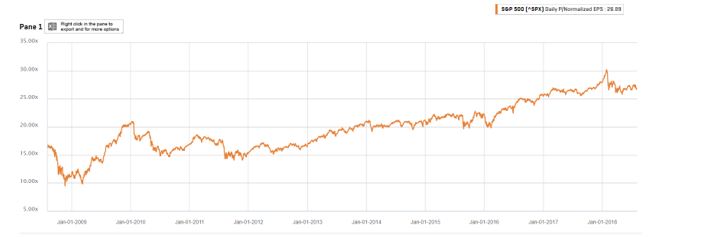
Source: Standard & Poor’s
High readings indicate overvaluation. This chart appears to show the index, which is a proxy for the broad stock market, is overvalued. But, some analysts argue that earnings can be manipulated and that makes the P/E ratio less reliable than it could be.
There is some truth to this idea but the word “manipulation” can carry a negative connation. The truth is that earnings depend on a number of management assumptions. These assumptions are within the scope of management’s duties but lead to variations of what’s included and not included in EPS.
To overcome this variability, analysts have come up with other ratios. Another popular ratio is the dividend yield which is shown in the next chart. Lower dividend yields indicate overvaluation since lower yields indicate less income for investors.
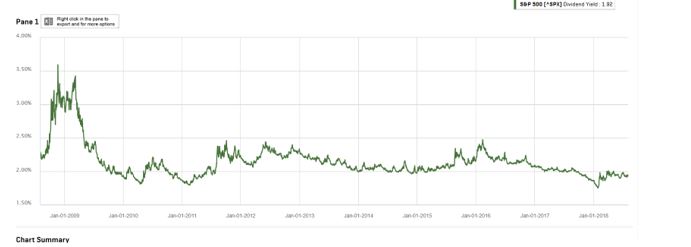
Source: Standard & Poor’s
These two charts show another problem which value investors face which is the fact that many indicators will show the same message. One approach to addressing this problem is to consider a large number of indicators.
By using a large number of indicators based upon different aspects of a company’s or index’s financial health, the investor can gain a different view into the market.
Of Two Dozen Indicators, Some Are Bullish
The chart below takes this approach and uses valuation metrics that measure the market’s earnings, balance sheet information, cash flow and other fundamental factors.
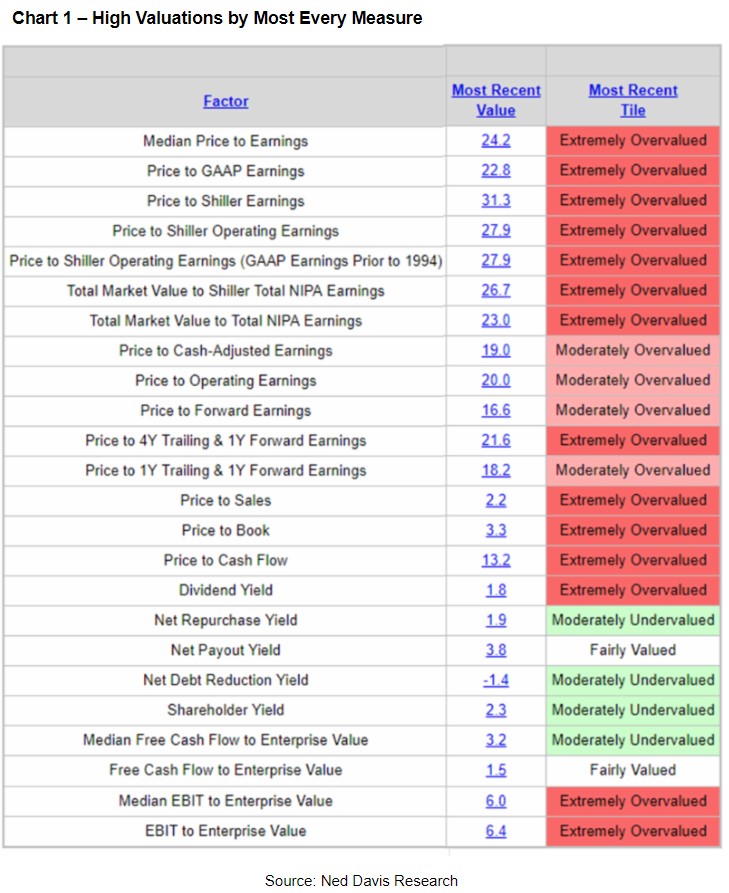
Source: CMG Wealth
Notice that just a few of the indicators are either fairly valued or undervalued. These indicators are based on measures that calculate returns to investors and cash flow.
These could be the most important valuation metrics even though they are among the less widely followed indicators.
The term shareholder yield captures the three ways in which the management of a public company can distribute cash to shareholders: cash dividends, stock repurchases and debt reduction.
Dividends are the most obvious form of distributing cash. Stock repurchases also increase shareholder value provided that the shares purchased are cancelled or held in treasury but not used as a device to make up for dilution from option issuances to management and others.
Reducing debt can also produce a de facto dividend; assuming the value of the firm remains the same, shareholder value is increased as debt is reduced.
To understand how debt reduction increases shareholder value, it is helpful to consider the 1958 paper by Nobel laureates Franco Modigliani and Merton H. Miller entitled The Cost of Capital, Corporation Finance and the Theory of Investment. This is one of the fundamental papers in finance.
This paper proved that a firm’s value is independent of how it is financed, provided that one ignores the tax effect of debt interest. If Modigliani and Miller are correct, the use of free cash flow to repay debt results in a transfer of wealth from the debtor to the shareholder. Shareholder yield assumes they are correct.
Shareholder yield is a fairly new concept. The term appears to have been first used by William W. Priest of Epoch Investment Partners in a paper in 2005 entitled The Case for Shareholder Yield as a Dominant Driver of Future Equity Returns as a way to look more holistically at how companies allocate and distribute cash rather than considering dividends in isolation.
This indicator, as the chart above shows, indicates there is potential up side in the S&P 500. Measures based on free cash flow confirm this.
Free cash flow represents the cash a company can generate after required investment to maintain or expand its asset base. It is a measurement of a company’s financial performance and health. Free cash flow is the cash flow available to all investors in a company, including common stockholders.
It’s interesting that measures show up side potential because they may be the most important factors to investors and to companies.
Shareholder yield, as noted above, measures how companies are rewarding investors. Free cash flow measures how much capital companies have available to reward investors.
Current levels of these indicators tell us that management teams have capital that they can use to grow their companies and reward shareholders. The shareholder yield indicates much of the free cash flow is going into reinvestment. This bodes well for the future.
It is also important to remember that EPS and other financial information can be affected by management’s decisions. But, shareholder yield and free cash flow are generally considered to be among the variables that can be least manipulated. And, they tell us stocks are undervalued now.