Investing in Your Home Might Be Profitable
Home ownership can be a surprisingly controversial topic among investment experts. The question of whether or not a home is an investment is often debated. Those against counting a home as an investment often point to charts like the one below.
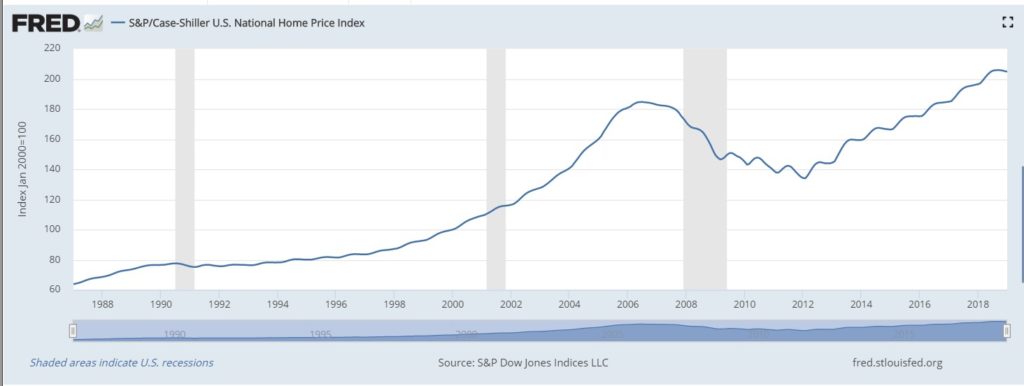
Source: Federal Reserve
This is a chart of the Standard & Poor’s Case–Shiller US National Home Price Index. This is one of the indices maintained by S&P that are repeat-sales house price indices for the United States.
The repeat-sales method, according to Investopedia, “is a manner of calculating changes in the sales price of the same piece of real estate over specific periods of time. Housing market analysts use repeat sales to estimate changes in home prices over a period of months or years.
Various housing price indexes use the repeat-sales method to provide information about the housing market to homebuyers and sellers, housing market investors, and those working in the housing and housing finance industries.
The majority of housing price indexes track home prices in a specific region over a specific period of time. However, the manner in which the index is calculated can create structural problems where the index does not present an accurate picture of housing price trends.
Flawed calculations would include those that pick random samples of houses to track as all these homes may not be for sale or there structures and types could be very different.
An index which tracked the median home price in a specific area – such as the National Association of Realtors (NAR) Median Index or the Census Bureau Median Index – would not identify changes to the structure of homes versus outside market factors which may affect price.
The Repeat-Sales Method was adopted to overcome these structural issues as it was created to track the change in price of real estate between a current sale and any previous sale.
An advantage of repeat-sales methods is that they calculate changes in home prices based on sales of the same property, so they avoid the problem of trying to account for price differences in homes with varying characteristics.
Repeat-sales methods also offer a more accurate alternative to regression analysis or to calculating average sales price by geographic area.
A shortcoming of repeat-sales methods is that they don’t account for homes that were sold only once during the reported time period. These sales are also meaningful indications of housing market activity.”
The index shown was developed by economists Karl Case and Robert Shiller, the indices are calculated and kept monthly by Standard & Poor’s. The indices kept by Standard and Poor are normalized to have a value of 100 in January 2000
But the data goes back into the 1800s. From the year 1880 to 2012, according to AWealthOfCommonSense.com, “the after-inflation return for the average price of a home in the U.S. was a total of 23.25%.
So in 132 years, again after accounting for inflation, the average price of a home went up only 0.16% per year! From 1880 to 2006 (the high point of the housing bubble) it was up a total of 96.18% or 0.54% per year.
In fact, most of the housing performance came in the 1996 to 2006 time frame when the total real return was 83.80% or 6.28% per year. And when the bubble burst there were huge losses.
From the 2006 peak to the low in early 2012, after inflation prices were down -42.49%.”
Does this mean homes are a bad investment? Maybe. Home prices go up and down. But you most likely need a place to live and buying a home allows you to build equity as the mortgage is paid down. In this way, the home serves as an asset even if it’s not as attractive as an investment in the next big thing in the stock market.
Trends Can Change
While homes, have historically, delivered positive returns in the long run, that could change according to Barron’s which recently noted,
“Downsizing is a common feature of retirement planning. But two trends could throw a wrench into that: First, more older Americans are carrying debt, typically mortgages, into retirement.
Exacerbating this are housing trends that could pose a problem for baby boomers looking to sell large, suburban homes to pay off their mortgage and shore up retirement savings.”
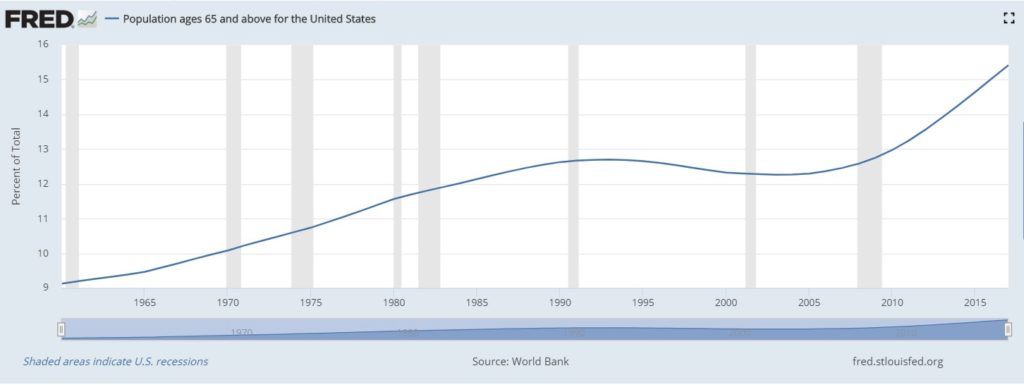
Fed data shows a significant increase in the percentage of senior citizens in the total population.
Source: Federal Reserve
Barron’s continued,
“Baby boomers are clearly more comfortable holding debt than the prior generation, which sought to pay everything off before retiring, says J. Michael Collins, faculty director of the Center for Financial Security at the University of Wisconsin.
About 70% of 65- to 74-year-olds held some debt in 2016, up from 52% in 1998; among those 75 or older, almost half had debt, double the ’98 level, according to the Employee Benefit Research Institute.
…And those banking on selling their home to pay off their mortgage or home-equity line of credit, and using the remainder to boost their retirement savings, could also run into trouble.
Already, there are signs that McMansions might not sell as quickly as before and that the allure of a big home in a good school district might not be as appealing to home buyers who are having children later, if at all.
The share of home purchasers with children slid from more than half in 1987 to about a third in 2018, according to research by Arthur Nelson, professor of planning and real estate development at the University of Arizona.
From now until 2040, nearly 30 million boomer households will want to sell their homes—the majority of which are in the kinds of suburbs that may not appeal to millennials and the next generation, Nelson says.
Only a fifth of U.S. homes are in the kind of walkable, mixed-use neighborhood that, surveys show, these home buyers prefer, he adds.
Based on preliminary research, Nelson estimates that, after factoring in inflation, about 10 million of those households could end up selling their dwellings for less than they paid for them—and those in slow-growing or declining cities could struggle to find a buyer.
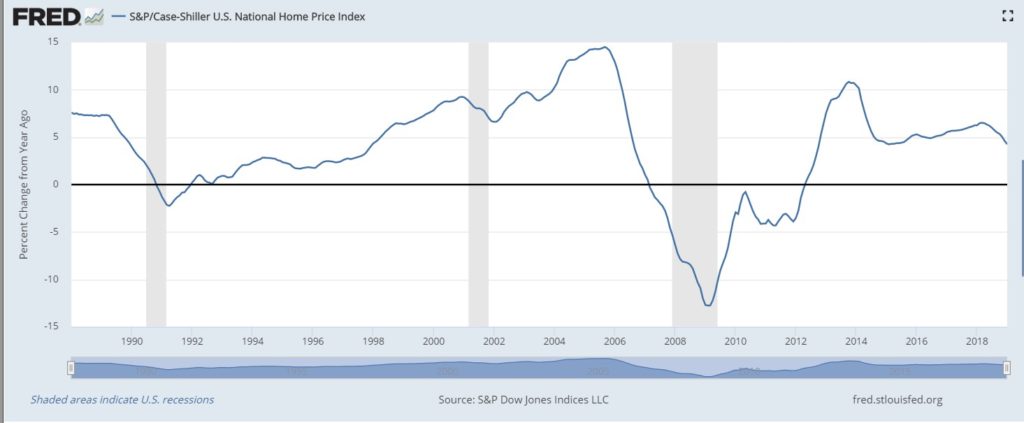
Already, the rise in national home prices is at its slowest pace since April 2015, according to the S&P CoreLogic Case-Shiller U.S. National Home Price index.”
Source: Federal Reserve
Slower price gains, “could be problematic for anyone planning to pay off a mortgage or Heloc with a tidy profit from a home sale.
“Many people got carried away with thinking of their homes as an asset on their balance sheet they could tap as readily as their liquid investment holdings. Unfortunately, it’s more complicated,” warns Christine Benz, director of personal finance at Morningstar.
“Ideally, your retirement plan—and your investment portfolio—will have enough flexibility so that you won’t be stuck if home prices don’t break your way.”
Other options: use the pause in the Federal Reserve’s interest-rate hikes to pay off the debt—or sell the house before more boomers flood the market.”
While doomsayers will always find cause to worry, the long term returns for homes are generally above zero and that is, of course, literally better than nothing.