How to Really Read Chart Patterns
Charts have been used by traders for hundreds of years. The practice was widespread by the early 1900s when many of the patterns traders spotted in charts had been given names, much like ancient civilizations had given names to clusters of stars they believed looked like lions and archers.
In 1930, Forbes magazine editor Richard Schabacker published the Stock Market Theory and Practice, the first book cataloguing chart patterns. From there, an explosion of interest in patterns developed.
In 1948, Robert Edwards and John Magee published Technical Analysis of Stock Trends, a book still considered to be the authoritative reference of chart patterns. There really hasn’t been anything new written about patterns in almost 60 years and the old rules laid out by 1948 are still widely followed.
One example will show how Edwards and Magee described patterns. They wrote that a head and shoulders consists of three peaks in price occurring at the end of the uptrend, with the center peak being higher than the other two.
The two “side” peaks should be about equal in height. The three peaks give the pattern its name, with the center being the head and the right and left shoulder forming on either side of the head. Connecting the bottom of the peaks gives us the neckline.
When prices break below the support level drawn as the neckline, we have a sell signal because that indicates the uptrend is reversing. A picture is easily worth 1,000 words here, so the chart below shows the pattern. It’s a chart of the top that preceded the 2008 bear market.
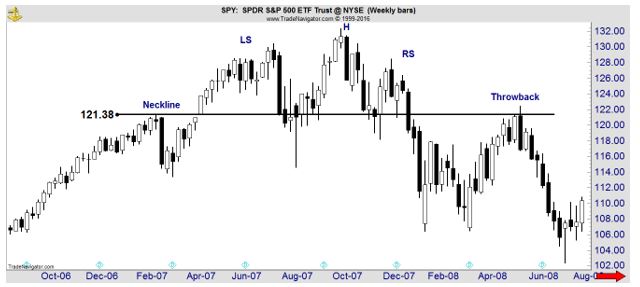
This is a chart of SPDR S&P 500 ETF (NYSE: SPY) in 2007. The head of the head (H in the chart) marked the exact high in the stock market. The shoulders are not perfect but no pattern will ever unfold perfectly. The left shoulder (LS) is part of the uptrend followed by a normal pullback.
The uptrend resumes after the pullback and the move to a new high results in the formation of the head. We then see another pullback before a rally that fails to set a new high which is the right shoulder (RS). A break of the neckline indicates the trend is over but we often see a “throwback” or a rally that fails before reaching the high of the right shoulder.
The key element of any pattern could be a degree of symmetry. For this idea, the picture below is worth a few thousand words.
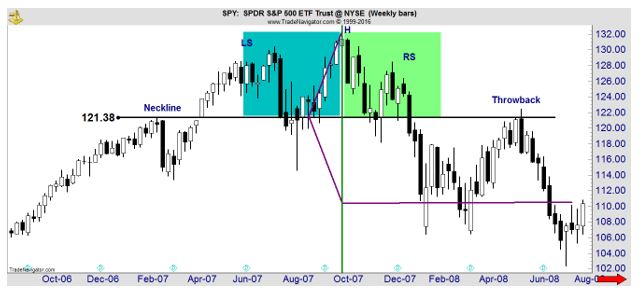
The blue and green rectangles highlight market action that is slightly similar, at least from a subjective perspective. In the rectangles we see two pullbacks that moved below the neckline briefly. The two rectangles are the same size, showing the price action took a similar amount of time to unfold.
The symmetries here are very rough but the purple line shows a high degree of symmetry. The lines drawn at angles from the neckline are the same length showing the distance from the neckline is roughly equal to the initial decline in price after the neckline was broken.
This symmetry is consistent in all patterns and is the most important point of any pattern you spot. The height of the pattern provides a tool to find price targets.
Another characteristic of a pattern is the existence of support or resistance. In the head and shoulders we saw support at the neckline. All patterns are simply defined as price action bounded by two lines and these lines could also be called support or resistance.
This is true for a falling wedge, a rectangle, a cup with handle, a triangle or any other pattern. No matter what the pattern is, the distance between those two lines is the important point of the pattern. We should expect prices to move at least that distance when the price breaks out of the pattern.
Here’s another example, using a recent chart of iShares MSCI United Kingdom ETF (NYSE: EWU).
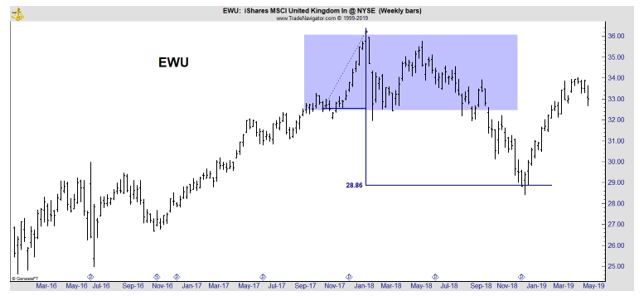
Because chart patterns are subjective, the name of the pattern will not be important. We could call the highlighted area a double top. What is important is that the pattern is about $4 high. That’s found by subtracting the top from the bottom.
This doesn’t need to be precise. Patterns are imprecise and should be used as guidelines so being off by a few cents won’t affect your analysis.
To find a target, after prices break out of the pattern, subtract the height of the pattern ($4) from the bottom of the pattern. That’s shown in the chart and the decline stopped at the target. This gave a clear buy signal.
While patterns are usually found with a visual approach, patterns can also be identified in objective terms, as I mentioned earlier.
MIT professor Andrew Lo defined a head and shoulders chart pattern as price action where “the magnitudes and decay pattern of the first twelve autocorrelations and the statistical significance of the Box-Pierce Q-statistic suggest the presence of a high-frequency predictable component in stock returns.”
The important part of his definition is simply that the pattern can be described in terms that can be programmed. This makes it testable.
In Foundations of Technical Analysis: Computational Algorithms, Statistical Inference, and Empirical Implementation, working with Harry Mamaysky and Jiang Wang, Lo found that the head and shoulders pattern, when combined with several other indicators does “provide incremental information and may have some practical value.”
This is not high praise but it does indicate there is no need to ignore patterns. Other researchers have reached similar conclusions when testing a variety of patterns. In general, they find patterns work sometimes and can be useful as part of a trading strategy.
This leads to our conclusion which is that charts could be one input in an analysis. It’s best to look for an area on the chart where support and resistance is obvious. Then identify a price target and trade when the breakout occurs.
Don’t worry about what the chart pattern is called since all price objectives are found with the same technique. The true value of charts is that they are one of the few tools that allows traders to quickly develop price targets and that can allow for trading with increased confidence.