Hindenburg Omen: Great Marketing or Important Signal?
Wall Street is a unique place. It is an actual place where many people work in the financial sector. It is also a description of a theoretical place since many jobs connected to finance are not physically located in New York.
But, the idea of Wall Street is a powerful one and demonstrates the importance of ideas to the finance industry. After all, there is a degree of marketing associated with the industry and the marketing can, at times, be found in names of indicators.
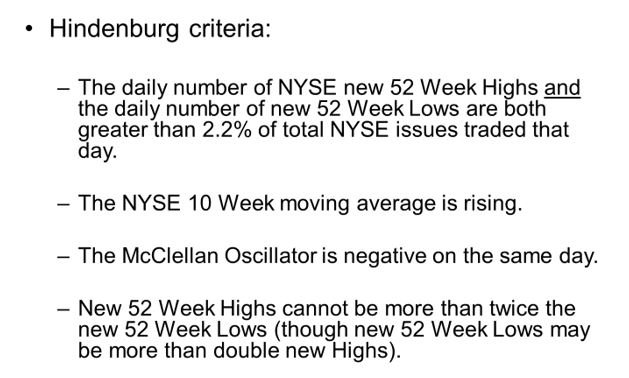
Among the indicators that appears to be named to capture headlines is the Hindenburg Omen. This indicator is triggered when five different conditions are met including that “the daily number of NYSE new 52-week highs and the daily number of new 52-week lows must both be greater than 2.2% of total NYSE issues traded that day.”
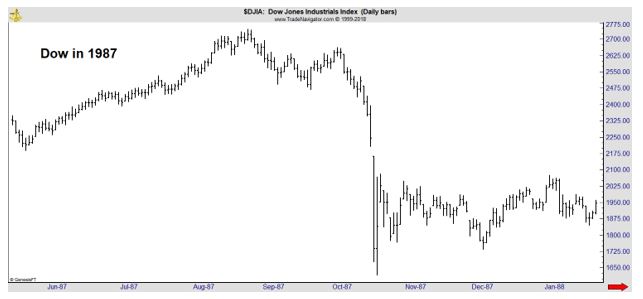
The indicator appears to have been developed to fit the unique circumstances of the 1987 crash.
Since then, the indicator has had a less than stellar track record. To help improve the performance of signals, many analysts now look for a cluster of signals which means that a number of omens appear within a short period of time. That approach is now signaling a sell.
A Cluster of Omens Appears
Bloomberg reported that “Sundial Capital Research Inc., points to a (controversial) group of potentially bearish technical signals known as the Hindenburg Omen.
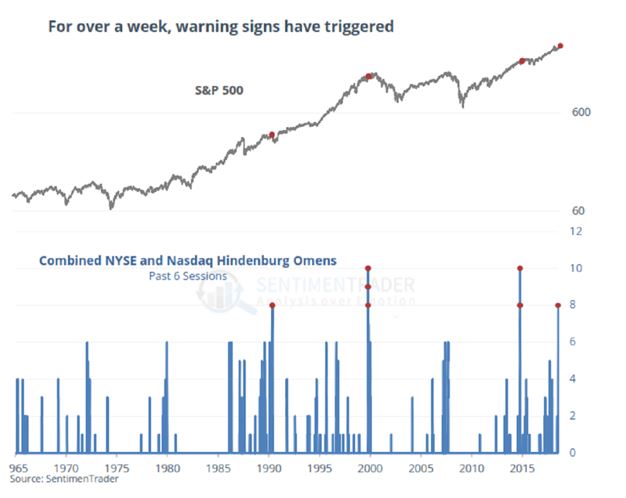
Deteriorating breadth in share gains and a jump in the number of individual stocks falling to 52-week lows has triggered a warning flag every day for over a week,” Jason Goepfert, the firm’s president, told clients.
On both the New York Stock Exchange and the Nasdaq there have been eight of these technical patterns over the past six sessions, he said, the biggest cluster since 2014 and the third-longest stretch in 50 years.
Source: Bloomberg
The indicator, named after the German zeppelin that caught fire and crashed more than eight decades ago, gauges indecision in the market and is designed to predict a decline within 40 days.
While it has a mixed track record and has been derided in some corners of Wall Street, references to the Hindenburg Omen in investment-bank research still trigger discussion.
Goepfert says it’s rare to see this number of clusters so close together on both exchanges and, in the past, they preceded declines. The median two-month decline after similar clusters was 2.2 percent, he calculated.
As for specific trading advice, “Consumer staples and health-care stocks performed best, with technology shares lagging behind, he said.”
But, the chart above shows that just two of the four highlighted signals led to significant market declines. Investors would have missed significant gains by following all the signals. That means if this signal is followed, the investor should define what would cause them to buy back into the market.
That could be the most important part of any defensive action an investor takes. Knowing when they will invest again could avoid problems with holding cash for too long.
Concerns With the Hindenburg Omen
There are reasons to be wary of the signals generated by this indicator. One is that the calculation appears to be curve fit.
Curve fitting is the process of constructing a curve, or mathematical function, that has the best fit to a series of data points. The problem with curve fitting is that the indicator will be designed to work perfectly in the past, but the future is unlikely to be the same as the past.
One sign that the indicator could be curve fit is the use of so many criteria. Generally, an indicator with more than 3 criteria should be followed with caution. Each additional criterion decreases the likelihood of future success in some way.
Another indication of curve fitting is the use of precise but seemingly variable variables. For example, in the Hindenburg Omen, one of the criteria is that the daily number of NYSE new 52 Week Highs and the daily number of new 52 Week Lows are both greater than 2.2%.
That is a precise value but one might wonder where it came from. Testing shows that if 2% is substituted, the Omens are frequent and not useful. The same with 2.3% and other values that are close to 2.2%. It appears that this variable was selected because it worked for the 1987 crash.
The chart below shows the history of signals before the current bull market began. Notice they do not occur close to all important market tops.
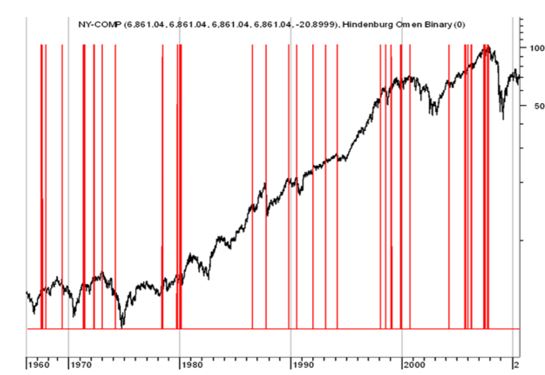
That is a problem. Missing out on gains that occur near the end of a bull market can be a costly mistake. This is the time when prices tend to move sharply higher and gains can be quick. Missing these gains can have a large and adverse impact on accumulating wealth.
Ignore Omens or Sell?
This leads to the important question of whether or not the signals should be ignored or acted upon. There is no easy answer to this question.
An important consideration is that if the stock market does sell off in the next few weeks, some traders may regret ignoring the signal if they do not act on it. This could lead to problems in the future if it affects their confidence to make buy and sell decisions.
That problem must be considered, but it should not be the determining factor. If an investor decides to act on the Hindenburg Omen or on any signal that is derived from the price action, they should consider committing to act on all of the indicator’s signals in the future.
No signal will ever be accurate 100% of the time. That means picking and choosing which signals to take and which to ignore increases the possibility of making an unprofitable decision. This behavior could also lead to regrets and regrets could lead to inaction in the future.
It could be best to focus on several indicators. The Hindenburg Omen could be one but trying to time market turning points can be difficult, if not impossible to do on a consistent basis. Many successful investors adopt trend following strategies to avoid this problem.
From a trend perspective, investors should be holding onto stocks since prices are rising.