Finding Winning Stocks With the Most Potential
Many investors study the past to find potential winners in the future. The idea is that stocks that did well in the past have attributes that can be used to spot potential winners in the future. This idea will not be foolproof, but it can be useful to consider the past.
A recent article at AAII.com prepared a study on this question. “The companies chosen for the study were based on companies in “The Greatest Stock Market Winners: 1970-1983,” published by William O’Neil & Co.
To be considered a great winner, a company typically had to at least double in value within a calendar year, although there were a few exceptions to this guideline, and not all companies that doubled in value were selected.
On average, the 222 winners increased in value by 349%. While this average was buoyed by a few winners with astronomical increases, more than half the firms increased in value by at least 237%.
Historical fundamental and technical information on these firms was taken from the Datagraph books (also published by William O’Neil & Co. and sold primarily to institutional investors).
The results of this study are summarized in the table below.
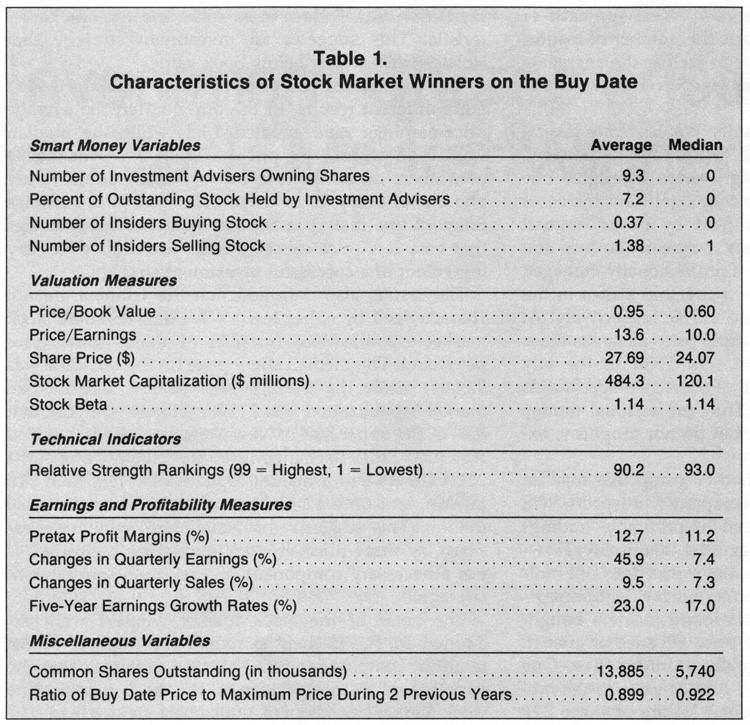
Source: AAII.com
The first group of indicators, the smart money variables, do not seem to be useful in predicting major stock market moves.
Next, the study looked at five different valuation variables.
Among the 222 winners, 164 were selling for less than book value in the quarter in which the buy occurred.
The median price-to-book-value ratio was 0.60, while the average ratio was 0.95. (The median is the exact midpoint, where half of all ratios fall above and half fall below; it is used because it is less influenced by extreme values.)
While a price-to-book-value ratio of less than 1.00 may not be a perfect indicator of a stock market winner, it does seem to be a common characteristic. This suggests an investment strategy that isolates firms selling below book value.
Only one out of every 10 of these firms had price-earnings ratios of less than 5.0 in the buy quarter. This indicates that very low price-earnings ratios are not a necessary ingredient of a successful investment strategy.
The results also indicated that the winners are not characterized by either low stock prices or small stock market capitalizations (number of shares times price per share).
This suggests that small size, whether measured by share price or stock market capitalization, is not a necessary component of a successful investment strategy.
The betas of the stock market winners were examined to see if their extraordinary rates of return might be compensation for riskiness. While the firms as a group were slightly riskier than the market as a whole, the additional stock market risk cannot account for the extraordinary returns of these winners.
The technical indicator measured among the stock winners was relative strength.
The relative strength of a stock is the average of quarterly price changes during the previous year, but giving more weight (40%) to the most recent quarter and less weight (20% each) to the three other quarters; these average changes are then ranked among all stocks, ranging from 1 (lowest) to 99 (highest).
Among the winners, the median rank in the buy quarter was 93; fully 212 of the 222 firms possessed relative strength rankings of greater than 70.
In addition, the relative strength rankings for 170 of the 222 winners increased between the quarter prior to the buy and the quarter during which the stock was purchased.
These findings show that investors should seek out firms with high relative strength rankings; and second, investors should try to identify firms that exhibit a positive change in their ranking from the prior quarter.
Several measures of earnings and profitability among the stock market winners were examined.
The average pretax profit margin in the buy quarter was 12.7%. In the quarter prior to the buy, the profit margin was slightly smaller, while by the sell quarter, the average profit margin had increased to 14.5%.
The nearly 2% increase in the pretax profit margins may have contributed to the significant price appreciation of these firms. Fully 216 of the 222 winners had positive pretax margins in the buy quarter and 215 had positive pretax margins in the quarter prior to the purchase.
This evidence clearly indicates that a high, positive pretax profit margin should be one of the selection screens in an investment strategy.
On average, quarterly earnings in the buy quarter rose nearly 45.9% from the previous quarter; these were not seasonally adjusted, and they represent changes in the raw accounting earnings.
Interestingly, quarterly earnings in the quarter prior to the buy increased an average of 60.8%, while in the quarter prior to that they increased an average of 50.4%—in other words, there was an acceleration in quarterly earnings.
Another investment rule suggested by the winners is to seek out firms with a positive change in quarterly earnings—earnings acceleration.
The pattern of changes in quarterly sales closely parallels that of changes in quarterly earnings. During the two quarters prior to the buy, quarterly sales were positive and increasing. During the buy quarter, quarterly sales on average increased 9.5%.
A longer term picture of earnings growth can also be useful. Investors should select companies that have positive five-year quarterly earnings growth rates.
Another useful screen is the number of common shares outstanding. Nearly 90% of the firms had fewer than 20 million shares of stock outstanding. Investors may want to select companies with fewer than 20 million outstanding shares of stock.
It’s also useful to look for stocks near new highs in price.
On the buy date, more than half the winners were selling within 8% of their previous two-year highs, and only one was selling at a price of less than half its previous two-year high. More than 80% of the firms were selling within 15% of their previous two-year highs.
An investment strategy that selects stocks selling within 15% of their two-year highs would capture a common characteristic of these winners.
These characteristics could help traders find the next big winners in the stock market.