Finding Value in an Overvalued Market
Let’s start by noting that the stock market is overvalued. Some analysts may argue against that premise, especially if they look at unique metrics. But, using the standard tools of fundamental analysis, the stock market is certainly overvalued.
This can be seen in the chart below which shows the price to book (P/B) ratio of the S&P 500 index. The P/B ratio is similar to the more familiar price to earnings (P/E) ratio in that low values are indicative of more value in the stock than high values of the ratio.
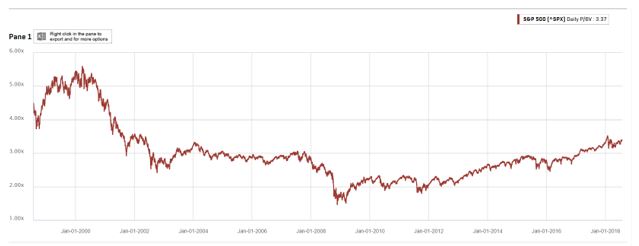
Source: Standard & Poor’s
One advantage of the P/B ratio compared to the P/E ratio is that the P/B ratio is less volatile. Earnings tend to move more erratically than book value which tends to move slowly. This makes it an ideal metric for evaluating changes in valuation over time.
A Historical Perspective on Overvaluation
The chart above shows that the P/B value is elevated. The current value is 3.37, about 13% above the long term average ratio of 2.98. That fact alone is one reason to note that the market is overvalued.
But, in looking at the chart, we can see that the P/B spends a great deal of time near its current level. The chart shows that the P/B ratio has spent years near the level it is currently at, around the value of 3.0.
In fact, the P/B ratio stayed near 3 as the bull market moved higher and higher before topping in 2008. This could indicate that the average is driven, at least in part by the extremes. It could be more useful to consider the range of values that is typical for the P/B ratio.
Over the past twenty years, there are more than 5,000 individual daily values for the P/B ratio. This allows us to consider the standard deviation of the value, a statistical measure that shows the amount of variation or dispersion of a set of data values.
A low standard deviation indicates that the data points tend to be close to the mean (also called the expected value) of the set, while a high standard deviation indicates that the data points are spread out over a wider range of values.
The standard deviation of the P/B ratio over the past twenty years is 0.85. That tells us that we should expect about 68.2% of the reading to be between 2.13 and 3.83. This is derived from the normal distribution which is shown below.
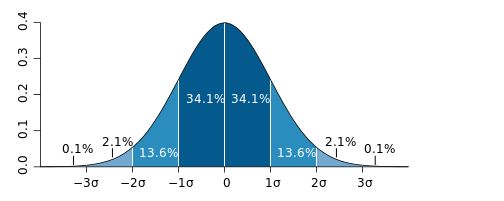
Source: M. W. Toews from Wikimedia Commons
This indicates the stock market is slightly overvalued since the P/B value is slightly above average. But, it is not overvalued enough to make a decline and a bear market almost certain.
Finding Value
Knowing that the P/B ratio is 3.37 provides us with a quantifiable method for finding value in the market. We can look for stocks that have a below average ratio, or we could even look for stocks with an even lower ratio.
One way to find stocks meeting that requirement is with the free stock screening tool available at FinViz.com. At this site, you could screen for a variety of fundamental factors, high levels of institutional ownership and bullish institutional transactions Or, you could just screen on the P/B ratio. An example is shown below.
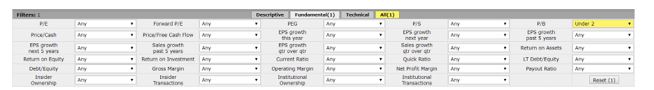
Source: FinViz.com
For this screen, we selected stocks with a P/B ratio below 2. This is more than one standard deviation below the long term average P/B ratio.
When running this screen, more than 2,200 stocks, more than 30% of the stocks in the data base, were offering this level of value. This can be filtered down by adding price or volume criteria or some other fundamental metric.
When using valuation as a screening tool, it can be important to add additional metrics to avoid value traps.
The Financial Times explains what a value trap is: A financial instrument (stocks or bonds) that appears cheap on historical measures or valuation grounds, such as price/earnings ratio, but the price never recovers to fair value.
Such “bargain” investments attract buyers because they hope that the price will go up in future so they will make money. However, the problem is that the stock price can fall again and may never go up unless there is a catalyst.”
The chart below shows General Electric (NYSE: GE), a stock which may appear to offer value but has been a value trap for investors who assumed the decline in the P/B ratio (also shown in the chart) fell lower along with the price.
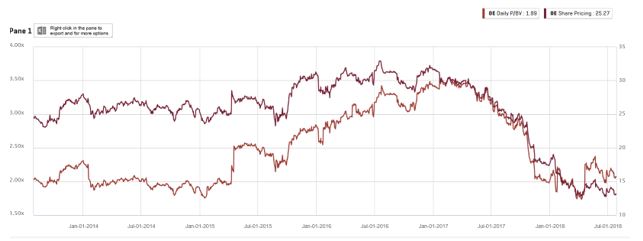
Source: Standard & Poor’s
To avoid a value trap, investors can simply wait for the stock price to start moving up. This is a relative strength based investing strategy and can be more successful than a strategy that relies solely on value or relative strength.
Returning to the Finviz screen above, we saw that 2,200 stocks offer value based on a low P/B ratio. We can narrow that list with additional filters.
Some investors may limit risk by investing only in large cap stocks. This is not a guarantee of safety but there is less risk of a large cap company going bankrupt than a small cap company. Using the Finviz screener we can filter by market cap to implement this idea.
That tool defines large cap stocks as those with a market cap of at least $10 billion. Adding that requirement to the low P/B ratio requirement reduces the list of potential investments to 724.
To find stocks that are going up, we can add filters for performance. For example, we could require the stock to be up over various time frames including the last day, the last week, month, quarter, six months, year or year to date.
When using value, it could be best to use longer term filters since value is a long term strategy. Requiring a gain over the last year eliminates more than 200 more stocks.
Investors could continue adding filters, for example requiring a dividend to be paid or a dividend yield of a certain amount to obtain income and value.
With this tool, it could be possible to find value and other potential investment opportunities in any market environment.