Computer Assisted Value Investing

Value investing predates the computer. But, it is a style of investing that is readily adaptable to automation. Value investing, at its core, is simply reviewing the financial data every publicly traded company is required to report every three months.
Its seeming simplicity is one of the reasons value investing is so appealing. But, as any investor who has tried to implement a value investing strategy knows, the ideas are far from simple.
According to one study, there are 156 different variables that are in a complete set of financial statements that includes an income statement, a balance sheet and a statement of cash flows. That is the starting point for value investors.
Now, the variables are usually analyzed in some way and that often requires comparing the value to some other variable. For example, the popular price to earnings (P/E) ratio compares the price of the stock to the earnings information which is found on the income statement.
Another technique is to compare the rate of change of a variable over time. This could involve comparing the level of sales reported in the current quarter to the level of sales in the same three month period a year ago. Or, current sales can be compared to sales in the previous quarter.
It quickly becomes apparent that there are a number of ways the financial statements can be used. Researchers have found that there is a total of 2,090,365 possible trading signals that can be developed with simple mathematical tools.
Which of the 2 Million Is the Best?
After learning of this study, many investors may think their work is done. All they need to know is the results of this exhaustive test and they will be able to beat the market. Of course, nothing in value investing is ever as simple as it sounds.
The researchers found that 17 studies delivered statistically significant and consistently profitable results. The best performing strategy is the one that subtracts retained earnings and other adjustments from the balance sheet value of the common stock outstanding and divides that by the company’s advertising expense.
There is no logical reason this ratio should highlight winning stocks and in fact, it is almost nonsensical to believe it would. It is a result of data mining and that is the purpose of the research paper. It was designed to show that investors should not rely on computers.
This study confirms earlier research that revealed the butter production in Bangladesh, U.S. cheese production, and the sheep population in Bangladesh and the U.S. could be combined to “explain” (in a statistical sense) 99% of the annual movements of the S&P 500 between 1983 and 1993.
It’s obvious that value investing needs to begin with logic and move on to automation.
Starting With a Logical Approach
The process of value investing begins with the definition of value. Here, investors have attacked the problem in simple terms and in complex processes. Among the most popular process on Wall Street is the discounted cash flow model, or DCF.
A DCF begins with the idea that a dollar in the future will be worth less than a dollar today. That means the purchasing power of a dollar is expected to decline over time due to the effects of inflation. That means future cash flows need to be discounted to determine their value today.
DCF models include assumptions about inflation to find the value of a stock. Assumptions are then made about the future cash flows a company will generate each year and the complete process becomes rather detailed.
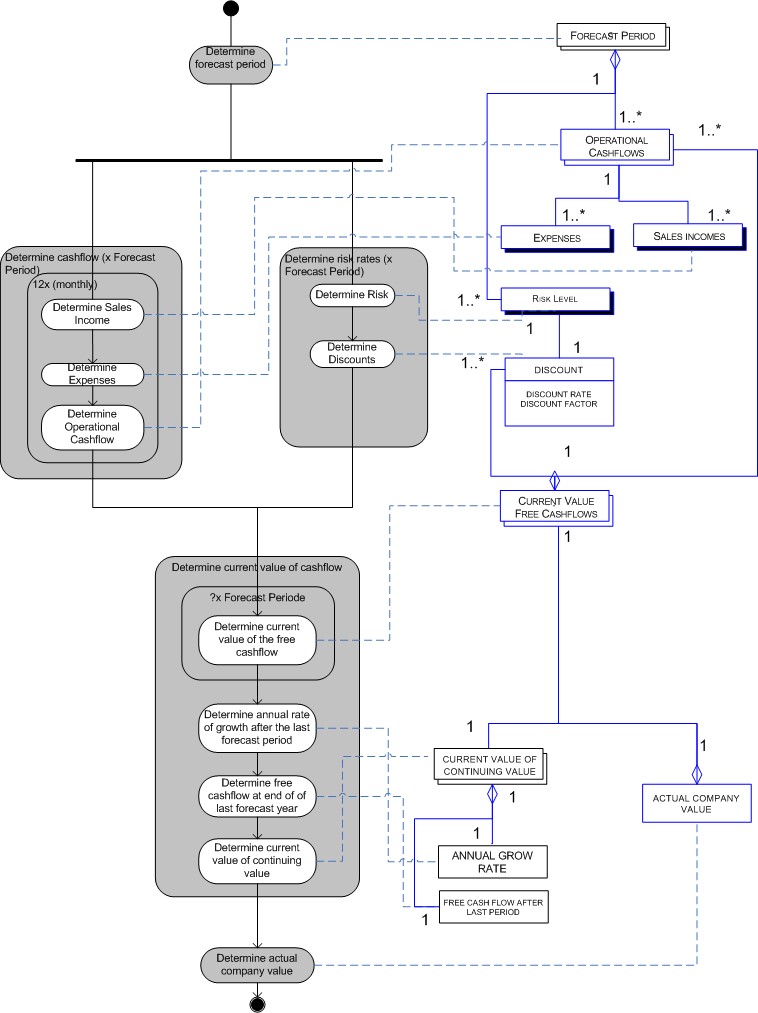
Source: Wikicommons
Because of the complexity, few individual investors use DCF models. Instead of focusing on absolute valuation techniques like they use, they use relative valuation tools like the P/E ratio.
However, the P/E ratio is just one tool. There is also the price to book (P/B) ratio and price to sales (P/S) ratio. These are all popular indicators that could be used in value investing.
Relative Valuation Value Investing
To apply these tools, an investor screens for the ratio in all stocks in the investment universe and then sorts from lowest to highest. The lowest values offer the best value.
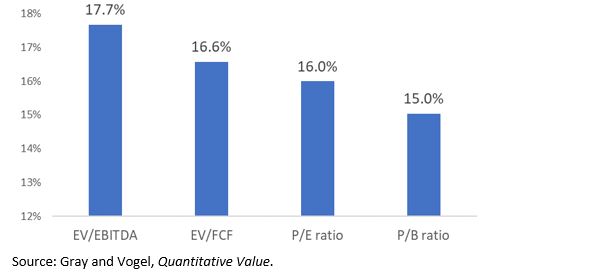
A tool many investors ignore is the EV/EBITDA ratio. This is the enterprise value (EV) to earnings before interest, taxes, depreciation and amortization (EBITDA) ratio. It includes a great deal of information and could be among the best ways to measure value.
At least that was the conclusion the authors of an upcoming paper reached. Two researchers and money managers, Wesley Gray and Jack Vogel, will be publishing “Analyzing Valuation Measures: A Performance Horse-Race Over the Past 40 Years” in the Journal of Portfolio Management.
They have already shared their results in a book, Quantitative Value. In the book, they found that the EV/EBITDA has historically been the best performing metric and outperforms many investor favorites including the P/E ratio and the P/S ratio.
Their study looked at the period from July 1, 1971 until December 31, 2010. Some results are summarized below.
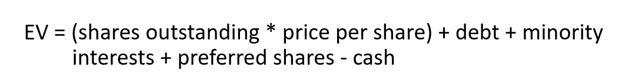
One reason the EV/EBITDA ratio may not be as popular as other tools is because it does involve more research to calculate.
The enterprise value of a company is a comprehensive measure of its market value. To calculate EV, you start with a company’s stock market capitalization (the number of shares times the market price). You then add the total amount of debt the company issued at current market value and subtract the amount of cash and cash equivalents they have on the balance sheet.
These tools will require access to specialized software or a web site that can automate the process. One way to find stocks meeting these requirements is with the free stock screening tool available at FinViz.com. At this site, you could screen for a variety of fundamental factors and technical characteristics.
However, there is no guarantee any stock will be a winner. Value investors should screen for the criteria they choose and then buy several stocks that are among the lowest ranked stocks by that measure. That is perhaps the best way to combine value and computers in a quantitative value strategy.