China’s Secret Could Make the Next Recession Deeper Than Expected

Debt makes recessions worse and recoveries more difficult. This was one of the conclusions emphasized in “This Time Is Different: Eight Centuries of Financial Folly,” a book by the well respected economists Carmen Reinhart and Kenneth Rogoff.
The economists noted, “drawing on data from 44 countries over 200 years, was that in both rich and developing countries, high levels of government debt — specifically, gross public debt equaling 90 percent or more of the nation’s annual economic output — was associated with notably lower rates of growth.”
Over the 800 years of study, these episodes were relatively rare:
“There were just 26 cases where the ratio of debt to G.D.P. exceeded 90 percent for five years or more; the average high-debt spell was 23 years. In 23 of the 26 cases, average growth was slower during the high-debt period than in periods of lower debt levels.
Indeed, economies grew at an average annual rate of roughly 3.5 percent, when the ratio was under 90 percent, but at only a 2.3 percent rate, on average, at higher relative debt levels.”
But, unless this time is different, and the book argues that this time is never different, the next recession will be relatively deep.
Why This Time Isn’t Different
The authors explained the reason for the title of their book in a National Bureau of Economic Research paper they published earlier:
“Major default episodes are typically spaced some years (or decades) apart, creating an illusion that “this time is different” among policymakers and investors.
A recent example of the “this time is different” syndrome is the false belief that domestic debt is a novel feature of the modern financial landscape. We also confirm that crises frequently emanate from the financial centers with transmission through interest rate shocks and commodity price collapses.
Thus, the recent US sub-prime financial crisis is hardly unique. Our data also documents other crises that often accompany default: including inflation, exchange rate crashes, banking crises, and currency debasements.”
That paper shows a cycle in defaults, an indication of excessive debt.
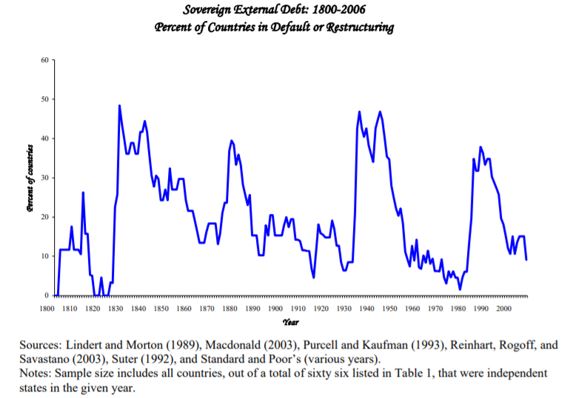
Source: NBER
We could be facing another crisis.
Debt Is High, And May Be Even Higher
The International Monetary Fund noted earlier this year that, “Global debt hit a new record high of $164 trillion in 2016, the equivalent of 225 percent of global GDP.
Both private and public debt have surged over the past decade. High debt makes government’s financing vulnerable to sudden changes in market sentiment. It also limits a government’s ability to provide support to the economy in the event of a downturn or a financial crisis.”
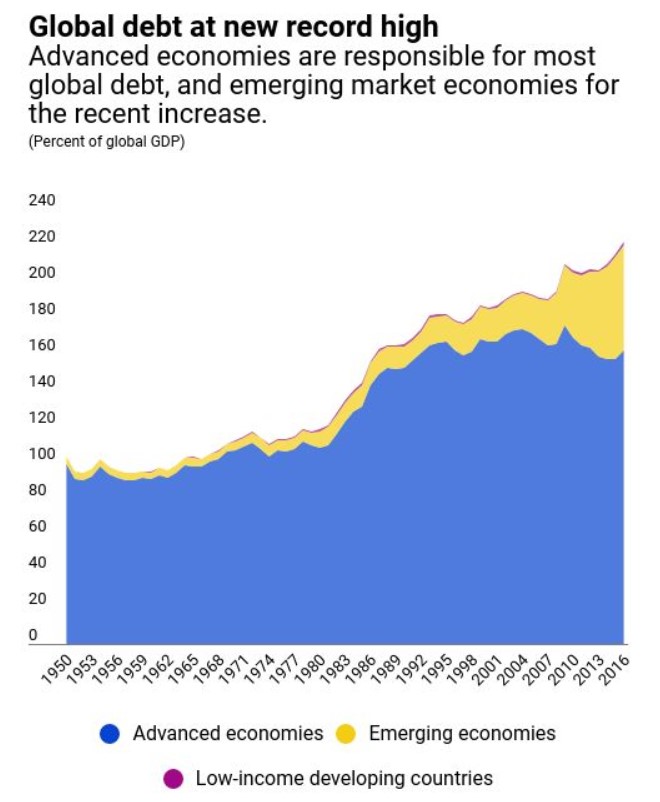
Source: IMF
The increase is broad based, “Debt-to-GDP ratios in advanced economies are at levels not seen since World War II. Public debt ratios have been increasing persistently over the past fifty years.
In emerging market economies, public debt is at levels seen only during the 1980s’ debt crisis. For low-income developing countries, average public debt-to-GDP ratios are well below historic peaks, but it is important to recall that debt reduction from earlier peaks involved debt forgiveness.
Moreover, low-income developing countries’ debt climbed 13 percentage points in the last five years.”
This, in itself, would be a cause for concern. But, the real amount of debt could be even larger.
Carmen Reinhart, the expert on debt in the long run, recently noted hidden debt from China that appears to be missing from official numbers.
“Over the past 15 years, China has fueled one of the most dramatic and geographically far-reaching surges in official peacetime lending in history.
More than one hundred predominantly low-income countries have taken out Chinese loans to finance infrastructure projects, expand their productive capacity in mining or other primary commodities, or support government spending in general.
But the size of this lending wave is not its most distinctive feature. What is truly remarkable is how little anyone other than the immediate players – the Chinese government and development agencies that do the lending and the governments and state-owned enterprises that do the borrowing – knows about it.
There is some information about the size and timing of Chinese loans from the financial press and a variety of private and academic sources; but information about loans’ terms and conditions is scarce to nonexistent.
Three years ago, writing about “hidden debts” to China and focusing on the largest borrowers in Latin America (Venezuela and Ecuador), I noted with concern that standard data sources do not capture the marked expansion of China’s financial transactions with the remainder of the developing world.
Not much has changed since then. While China in 2016 joined the ranks of countries reporting to the Bank for International Settlements, the lending from development banks in China is not broken down by counterparty in the BIS data.
Emerging-market borrowing from China is seldom in the form of securities issued in international capital markets, so it also does not appear in databases at the World Bank and elsewhere.
These accounting deficiencies mean that many developing and emerging-market countries’ external debts are currently underestimated in varying degrees.
Moreover, because these are mostly dollar debts, missing the China connection leads to underestimating balance sheets’ vulnerability to currency risk. While the amounts involved may be modest from the standpoint of China, the magnitude of the understatement (as a share of the recipient countries’ GDP) across all the borrowers is about 15%.”
In other words, there appears to be a problem according to the official data but the official data likely understates the magnitude of the problem.
What This Means to Investors
All of this is important because it requires a longer than average time for markets to recover from declines that occur when government debt is high.
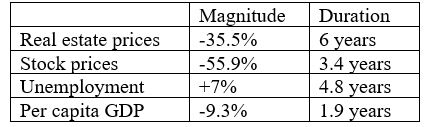
Source: Reinhart and Rogoff, 2011
The table above shows averages and covers markets in a number of countries over a number of centuries. Many may dismiss the data as irrelevant since, as the saying goes, this time is different. That could be a mistake. The next chart summarizes the 2008 crisis in the U. S.
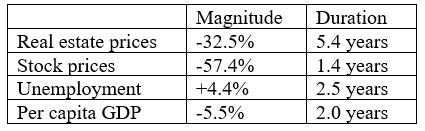
Results are very much in line with the averages. And, recovery takes years so investors should consider this information when making decisions. Now might not be the best time to make significant financial investments.