Bloomberg Shows Stocks Can Gain 40%

Source: Bloomberg.com
Some market research is truly more important than others. Generally, long term forecasts will have more value than very short term forecasts for individual investors since their trading costs will be high and access to rapid trade execution will be small.
In a similar manner, analysis by those who have been involved in the market for years will generally be more valuable than those providing analysis on a part time basis and with a focus on buzz words rather than history.
Finally, some sources simply should not be ignored. One of those sources is Bloomberg, a news service that has access to the best analysis. The firm also has access to any research that it believes will have value. So, when Bloomberg notes that a fundamental indicator is deeply undervalued, it’s important to take notice.
An Obscure Indicator Is Undervalued
Bloomberg recently reported that the PEG ratio is at a multiyear low. Before looking at what that means, let’s start with details on what the PEG ratio is.
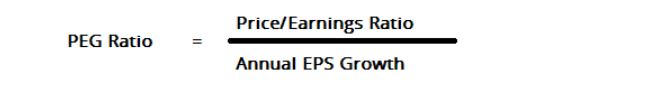
The PEG ratio compares a stock’s or an index’s price to earnings (P/E) ratio to the expected growth rate of earnings per share (EPS). The PEG ratio is an adaptive indicator since it adapts to the growth of a company to help determine whether the stock is undervalued or not.
This is important because it is possible a low P/E ratio, the traditional way to determine value, could be justified. Assume that a stock has a P/E ratio of 3. If the company is in bankruptcy and the stock price is destined to move to zero, the low P/E ratio doesn’t provide useful information.
That is an extreme example. But, consider a P/E ratio of 8 for a stock and assume the company is financially and likely to maintain its current level of sales and earnings for at least the next ten years. The P/E ratio of 8, in this case, might not represent a bargain.
Yes, the company is not likely to fail and the stock is unlikely to go to zero. But, the company is not growing and that indicates the stock price may not grow. The PEG ratio offers a way to determine when a P/E ratio is truly low.
Finding the PEG Ratio
The PEG ratio recognizes that investors are willing to pay a premium for growth. In fact, companies growing earnings at 45% a year, for example, should have a higher P/E ratio than a company that is growing earnings at 1% a year or a company with earnings per share that are contracting.
The PEG ratio provides a way to quantify value and growth. The ratio is found by dividing the P/E ratio by the expected EPS growth rate.
A ratio of 1.0 indicates a stock is fairly valued. PEG ratios less than 1 highlight stocks that are undervalued no matter what their P/E ratio is. Some analysts argue that PEG ratios greater than 1 show a stock is potentially overvalued.
But, over the long run, the PEG ratio of the S&P 500 index has averaged 1.4. It could be best to use a cut off value closer to 1.5.
The Current Picture
Bloomberg noted that now, the PEG ratio for the S&P 500 index is equal to 0.62. This is its lowest level since the bull market began in 2009.
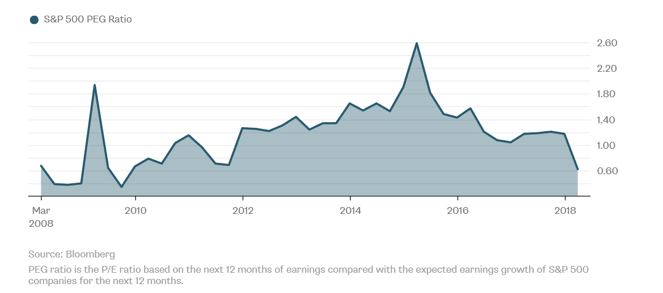
Source: Bloomberg
The ratio is low right now because earnings growth is expected to be high. Let’s look at the values for the PEG ratio to determine whether or not it is providing an important buy signal.
Bloomberg used the forward P/E ratio in their calculation. This is the P/E ratio using the current price and the EPS that are expected over the next twelve months. The current forwards P/E ratio is about 16.5, down from 18.1 after the sharp market sell off of the past few months.
The denominator in the formula, the expected rate of EPS growth is 27%, an unusually high value. The analyst notes, “But a lot of that growth isn’t sustainable. Much of it is coming from the tax cut. By the end of next year, earnings growth is expected to slow to just 11 percent.”
Of course, the EPS growth rate could be lower than expected. Wall Street analysts have generally overestimated earnings as the next chart shows.
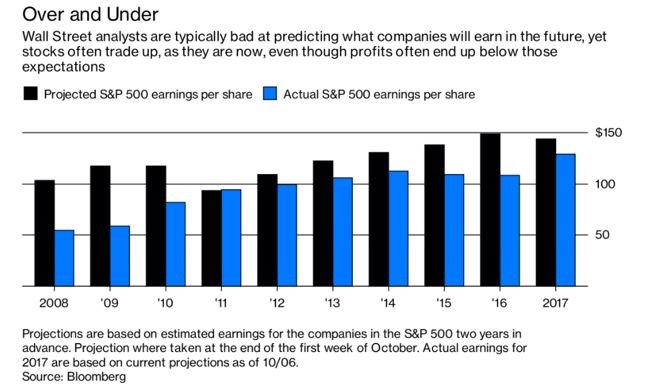
Source: Bloomberg
However, this time could be different. Much of the expected increase in earnings for the next year is due to tax reform. This is a permanent change in the company’s financials, or at least as permanent as anything related to the tax code can be.
That means that analysts are likely going to be proven correct that earnings growth will be much larger than average this year. And, that should push stock prices up significantly, even if earnings growth does drop back towards the average.
An Average PEG Ratio Indicates Stocks Should Rise
As the first chart above shows, the PEG ratio shares the mean reverting behavior of many other fundamental indicators. Mean reversion means that the indicator moves from below average to above average in a never ending cycle of movements.
Right now, it is below average. One year from now, it is likely to be higher as it reverts to the mean, which is a value of 1.4.
One year from now, uses Bloomberg’s estimates for earnings, the S&P 500 would have a value of 2,745 if the PEG ratio moves up to 1.4 and earnings estimates remain unchanged. This is above the current value of the index and confirms the S&P 500 is undervalued.
However, mean reverting indicators typically overshoot the average, or the mean. It is likely the PEG ratio will rise above its long term average of 1.4 and that indicates the S&P 500 is likely to be above 2,745 a year from now.
The index will not move straight up. It almost never does. There will be ups and downs but valuations indicate the index is likely to be higher one year from now, making now an ideal time for investors to establish positions in undervalued individual stocks.