Beyond P/E Ratios: A Better Way to Evaluate Companies
Value investing is a simple process in theory. The goal is to find a stock that is priced at a discount to its fair value and buy it. Then, hold it until the stock is fairly valued or even overvalued and sell it. It’s simply a method of buying low and selling high which is one of the secrets to success on Wall Street.
In practice, value investing is a difficult process and consistent profits can be elusive for value investors. There are many reasons for that but one of the overlooked problems with implementing value investing is that investors might be looking at the wrong numbers to make their decisions.
We don’t mean that the financial statements are wrong. They may be, but as investors we must assume management is accurately and fairly presenting the data in those statements. What we mean is that investors might not be using the best tools to analyze the data.
Defining Value With a Popular Indicator
The core of the value investing process is to apply a valuation tool to stocks in order to identify whether the stock if overvalued or undervalued. These metrics often combine a stock’s price with a piece of information found in the financial statements.
One example of a valuation metric is the price to earnings (P/E) ratio. To find the P/E ratio, analysts divide the price of one share of stock by the company’s earnings per share (EPS). In general, low P/E ratios generally define a stock that is undervalued and high P/E ratios are associated with overvaluation.
The P/E ratio is popular and can be profitable. In part, the popularity could be due to its simplicity since just two pieces of data are needed to calculate the ratio. But, the simplicity could be a source of some of the problems with the ratio.
The P/E ratio looks only at earnings, a number which is found on the company’s income statement. It ignores information found on the balance sheet, for example, and there could be problems lurking in a company’s balance sheet.
Consider a company that has issued a large amount of debt. The debt is not directly factored in to the P/E ratio. But, eventually companies need to repay debt when the bonds reach maturity. If a company is unable to meet that obligation, the company could be forced into bankruptcy.
In theory, the risk of that should be factored into the stock’s price. However, investors relying solely on the P/E ratio would simply see a low value and could believe the stock was undervalued. Unfortunately, the low price could reflect a negative outlook for the company.
Moving Beyond the P/E Ratio
To overcome this limitation, many investors look at multiple indicators. They may look at the price to sales (P/S) ratio, the price to book (P/B) ratio or the price to cash flow (P/CF) ratio. All of these tools are useful, but all also reflect the information from just one part of the company’s financial statement.
A tool many investors ignore is the EV/EBITDA ratio. This is the enterprise value (EV) to earnings before interest, taxes, depreciation and amortization (EBITDA) ratio. It includes a great deal of information and could be among the best ways to measure value.
At least that was the conclusion the authors of an upcoming paper reached. Two researchers and money managers, Wesley Gray and Jack Vogel, will be publishing “Analyzing Valuation Measures: A Performance Horse-Race Over the Past 40 Years” in the Journal of Portfolio Management.
They have already shared their results in a book, Quantitative Value. In the book, they found that the EV/EBITDA has historically been the best performing metric and outperforms many investor favorites including the P/E ratio and the P/S ratio.
Their study looked at the period from July 1, 1971 until December 31, 2010. Some results are summarized below.
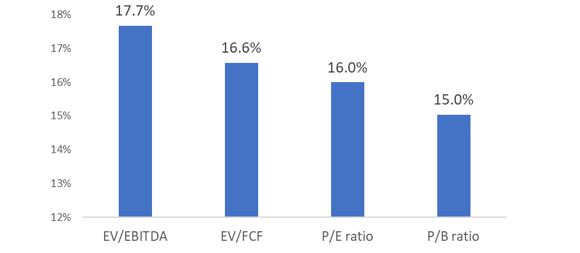
Source: Gray and Vogel, Quantitative Value.
One reason the EV/EBITDA ratio may not be as popular as other tools is because it does involve more research to calculate.
The enterprise value of a company is a comprehensive measure of its market value. To calculate EV, you start with a company’s stock market capitalization (the number of shares times the market price). You then add the total amount of debt the company issued at current market value and subtract the amount of cash and cash equivalents they have on the balance sheet.

This would represent the total cost of acquiring a company since a new owner would be acquiring the debt as well as the equity. Cash is subtracted in the calculation because it could be used to, at least partially, finance the purchase.
EBITDA is found by adding the expenses associated with interest, taxes, depreciation and amortization to the amount of net income.

EBITDA shows the performance of a company independent of the performance of its decisions related to taxes and capital structure. Earnings, for example, are reduced in some companies through tax strategies or by issuing debt to fund growth. EBITDA neutralizes the effect of those actions.
This ratio is available at a number of sites, including popular research sites like Yahoo and Google.
Applying EV/EBITDA
This ratio is used in practice like any other valuation metric. Low values are generally considered to be better than higher values.
This means that if you are comparing possible investment opportunities, it can be best to consider the one with the lowest EV/EBITDA ratio as long as the opportunities are in the same industry. It is important to remember as with any valuation metric, the average value for a company will depend upon which industry it belongs to.
Fortunately, there is a resource showing the average EV/EBITDA for an industry. This data is maintained by Dr. Aswath Damodaran, a Professor of Finance at the Stern School of Business at New York University who has written extensively on valuation and corporate finance.
Admittedly, the EV/EBITDA ratio may be difficult to find than the other, more popular valuation metrics that are readily available. However, in the investment industry, a popular saying among analysts is that “to know what everyone knows is to know nothing.”
This saying means that knowing information that is readily available, such as the P/E ratio, is not going to generally be rewarded with excess profits. In order to excel in this competitive field, you will be better served by finding information that is less readily available and less widely used.
The EV/EBITDA is widely used among professional investment managers and among investment bankers completing mergers and acquisitions. However, it is not widely used by individual investors and that can provide an edge, or an extra degree of profits, to individuals willing to work a little harder in pursuit of profits.