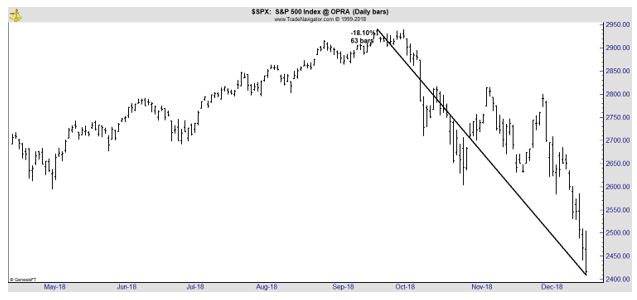
Bears Feed Off the Economy
As major stock market indexes fall to levels associated with bear markets, investors are considering an important question which is how far they could expect prices to fall. History shows the answer to that that could depend on the economy.
According to thebalance.com, “a bear market is when the price of an investment falls over time. It begins after prices have fallen 20 percent or more from their 52-week high.
The average length of a bear market is 367 days. The conventional wisdom says it usually lasts 18 months. Bear markets occurred 32 times between 1900 and 2008, with an average duration of 367 days. They typically happened once every three years.”
Refining the Definition of a Bear Market
There are other definitions of a bear market, some which more closely capture the experience of investors. The truth is waiting for prices to drop 20% can be devastating to an investor.
Imagine an investor who planned to retire at the end of 2018. The speed of the recent market move would have been potentially life changing since decisions would likely have been made to manage finances in the coming years.
While an investor expecting to retire within months might have decreased the risk of their portfolio, a large loss at the beginning of their retirement years changes things dramatically for some. It could mean lower than expected income, for example.
For that investor, a 15% decline could feel like a bear market, especially a rapid one. Because an investor’s perception of a bear market can be different than the standard definition of waiting for prices of major indexes to fall 20%, there are several other ways analysts define bear markets.
Among the most popular alternative definition is one provided by Ned Davis Research, a well respected firm. Their definitions of bull and bear markets are:
- A Bull Market requires a 30% rise in the Dow Jones Industrial Average after 50 calendar days or a 13% rise after 155 calendar days. Reversals of 30% in the Value Line Geometric Index since 1965 also qualify.
- A Bear Market requires a 30% drop in the Dow Jones Industrial Average after 50 calendar days or a 13% decline after 145 calendar days. Reversals of 30% in the Value Line Geometric Index also qualify. This applied to the 1987, 1990 and 1998 high and low.
This definition might be more meaningful to individual investors since an informal definition of a bear market could be a price decline that hurts, although the term hurts is not quantified and that would vary from investor to investor.
However, the Ned Davis Research definition captures declines that have unfolded since 2009 the more widely definition ignores.
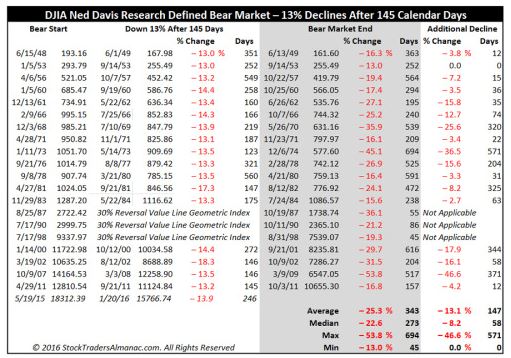
Source: Almanac Trader
Notice how this definition includes the declines in 2011 and 2015. The chart of the Russell 2000 index shows that these time periods included declines of more than 20% in small cap stocks, just like the current period.
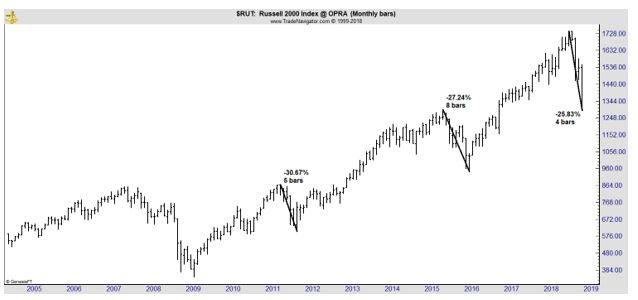
Even if these were not official bears, they were significant to many individual investors. They also highlight an important distinction between bear markets. These two declines occurred while the economy was expanding and that seems to lessen the severity of market sell offs.
Bear Markets Vary With the Economy
Thebalance.com also notes, “Bear markets are accompanied by recessions. That’s when the economy stops growing and then contracts. That causes layoffs and high unemployment rates.” However, that is not always the case. There have been bear markets when the economy is expanding.
Analysts at LPL Research noted, “going back to World War II, we found there have been 14 bear markets, with seven taking place during a recession and seven without an accompanying recession.”
The analysis continued, “as the LPL Chart of the Day shows, the seven bear markets that accompanied a recession were quite painful, losing 37% on average.
On the flipside, non-recessionary bears weren’t as painful. Looking at the previous four, three of them ended at 19% corrections (reaching the 20% threshold intraday).
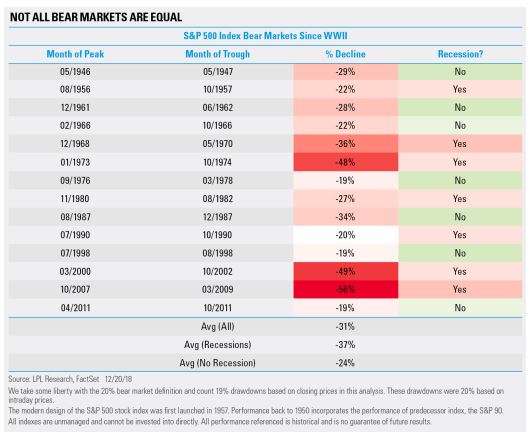
Source: LPL
While stocks fell 34% drop in 1987 without an accompanying recession, conditions were quite different than they are now. Remember, the S&P 500 was up more than 40% year to date in August 1987, so a potential violent snapback was likely.
“The bottom line is that you can have bear markets without a recession,” explained LPL Senior Market Strategist Ryan Detrick. “But, as we’ve seen over the past 40 years, if the economy is on firm footing, bears tend to stop around a 20% loss and the occurrences of a massive drop are quite limited.”
That means the depth of the current market sell off could depend on the state of the economy.
Arguments For the Bulls
While many analysts are concerned that a recession is possible, not all analysts expect the economy to slow that much. LPL Research sees both sides to the argument of whether bulls or bears will be in control of 2019. Their bullish case is summarized below:
Year to date, the S&P 500 is down 7.7%, yet earnings and gross domestic product (GDP) growth have been quite impressive, while stock valuations (price/earnings ratio, or PE) have compressed.
We previously saw stocks pause amid a strong economic backdrop with a drop in PEs in 1984 (real GDP 7.3% and earnings 21%) and 1994 (real GDP 4.0% and earnings +19%). Both 1985 (26% earnings) and 1995 (35% earnings) rebounded with strong S&P 500 returns. Could 2019 continue this trend?
Additionally, the midterm election year historically is the most volatile out of the four-year presidential cycle. In fact, since 1950, the S&P 500 in a midterm year has pulled back an average of 16.9%—the most out of the four-year cycle.
The good news? From the closing low in a midterm year, a year later stocks have been higher 17 of the last 17 times. Given the S&P 500 just made a new closing low this week, could this actually be a potentially good signal?”
In other words, there are reasons to believe the end of the decline is near. However, there are also reasons to believe that a bear market is just beginning, and the decline could take prices 40% or more below their all time highs if a recession begins.
No matter what an investor wants to believe, now is definitely a time for caution.