Applying Technicals to Cryptos

Cryptocurrencies are a new market. This is a technology that did not even exist a generation ago and is now a multibillion dollar market. However, many potential investors are still on the sidelines wondering whether or not the market carries too much risk.
It is important to remember that all markets carry risk. It is also important to remember that the level of risk is inversely proportional to the level of the potential rewards. Markets offering high rewards carry higher level of risks.
This relationship explains why the stock market delivers larger average returns over the long run than a money market fund. The money market fund carries almost no risk in the sense that a significant amount of the original investment is unlikely to be lost. Safety provides low income.
On the other hand, the stock market presents a larger risk. Stocks can, and often do, decline in value. This means the investor should receive a greater reward, on average and in the long run, to accept the higher degree of risk.
Crypto markets carry even more risk than the stock market. This can be seen in volatility that results in prices moves of 10% or more in a single day at times. We generally see a move like that in the stock market requiring months to unfold.
The great risks of the crypto markets carry high potential rewards for the investors in those markets. Fortunately, there are some tools that can be used to manage the risks of the markets.
Apply Momentum Indicators to Crypto Markets
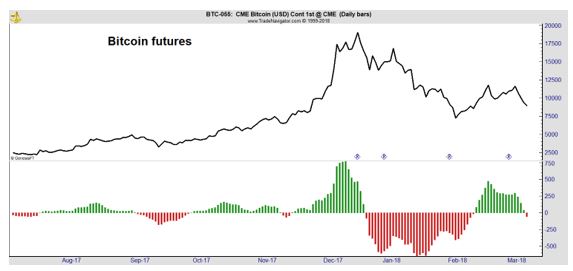
The MACD is one of the most popular technical indicators. It is widely available on a number of free web sites and is frequently shown on charts. While the indicator is widely applied to the stock market and to individual stocks, it is less widely applied top crypto markets, even though it could be.
Formally, MACD is the Moving Average Convergence-Divergence indicator. It’s been available to traders since at least the 1970s when Gerald Appel began writing about it. The indicator is most commonly viewed as a series of bars, like the ones shown below prices in the chart below.
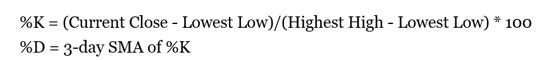
The indicator consists of two lines. One is slow (%K) and the other is fast (%D). The calculation is, of course, done for us at many free web sites including StockCharts.com and TradingView.com. An example of the calculation is shown in the chart below.
Because of the way it is calculated, the indicator will always have a value between 0 and 100. It will oscillate around 50, the midpoint. Movement around a midpoint makes stochastics an oscillator. The fact that it is bounded within a range allows us to create rules defining when we should expect a reversal.
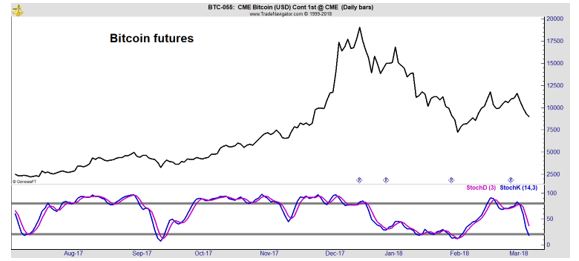
In the chart above, %K is shown in blue and %D is shown in magenta. This interpretation is equivalent to the way a moving average would be interpreted.
When the slow line is above the fast line, the trend is up. Think of price (the fast line) and a moving average (a slow line) to visualize this relationship. When the fast line is above the slow line, the trend is down.
Crossovers are just one way that stochastics are used. The indicator also identifies potential trend reversals when it becomes overbought or oversold. An overbought condition exists when momentum has moved up too fast and an oversold extreme occurs when momentum falls too fast.
In the chart above, extremes are marked with solid grey lines. The oversold level for stochastics is usually set at 20. Overbought is defined as reading above 80. The idea is that prices are due to decline when the indicator moves above 80. A reading below 20 is believed to indicate a rally in prices is imminent.
Buying when stochastics is oversold would have been profitable in the past.
These simple and popular tools can be readily applied to crypto markets and could reduce risk for traders who would then know when they should sell and hold cash in the markets.
You can read more about cryptocurrencies, here.