Finding best safe dividend high paying stocks

It happened in 2008 with big banks and many large companies. The stock price fell, and the dividend yield soared. Learn about Finding best safe dividend high paying stocks. Income investors saw high yields and bought the stocks, only to see the dividend get cut or eliminated.
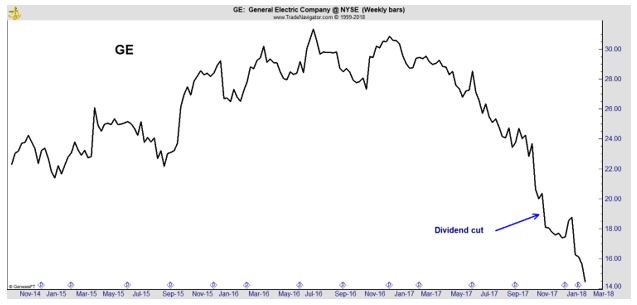
But, that’s not the only time that happened. Investors in General Electric saw their dividends cut just last year. In November, General Electric cut its dividend for only the second time since the 1930s.
To compound the paid of a dividend cut, the stock price of the company often falls sharply on the news that management has decided to reduce the payout. In the case of GE, the stock price fell more than 10% in the week after the cut was announced.
Investing in stocks carries risks and the risks can never be completely eliminated. But, prudent investors can reduce risks. If you hold dividend paying stocks, or are considering buying one, it could be worth checking just how safe that dividend is.
A Dividend Safety Checkup
While this process will not eliminate risks, it can help you. Every quarter for stocks you own, or before making a new purchase, if income is a priority, consider reviewing some more obscure fundamental indicators.
First, check for how well the dividend is covered. Coverage means how much of a company’s earnings or cash flow are dedicated to dividends. A high ratio is often unsustainable and a sign that a cut is near.
The dividend payout ratio is found by dividing the dividend per share by a company’s reported earnings per share. A ratio above 50% could be a warning sign that the company is dedicating too much of its earnings to dividends.
In addition to paying for dividends, earnings are also used by companies to reinvest in their business or to fund acquisitions that help them grow.
While a ratio of 50% is a warnings sign, a ratio above 100% is an outright red flag that cannot be ignored. If the dividend exceeds earnings, especially for a few years in a row, the situation is unsustainable, and the payout is likely to be cut.
The dividend coverage ratio is found by dividing the company’s reported cash flow per share by the amount of the dividend per share. Conservative investors would want to see a coverage ratio of at least 120% to demonstrate the dividend is safe.
Check for Growth
Many companies increase their dividend every year. This is positive signal for investors since an increased dividend shows that management is confident the company is positioned for growth.
However, investors tend to expect predictability from a company. They could become concerned if a company fails to increase its dividend for a year or if the pace of the increases slows compared to the recent past.
To check for the sustainability of dividend increases, look at the dividend growth rate over the past five years. Compare that to the earnings growth rate over the same time. Obviously, earnings should be faster than dividends.
It can be helpful to compare the ratio of dividend growth to earnings growth for a company to its peer group. This will take a little extra work but a company with a ratio that is below its industry average could be set up for a future dividend cut in the next economic downturn.
Avoid High Levels of Debt
Debt can be especially problematic when interest rates are rising as they are now. Companies often refinance debt as it comes due or borrow at variable rates. One of those options can prove to be expensive in a rising rate environment. A detailed review of debt can require extensive effort but income investors can focus on just a few warning signs.
One is the debt to equity ratio. The amount of total debt a company has can be found on its balance sheet. Its equity is also reported on the balance sheet. Here, again, a comparison to the industry average will be helpful because debt loads vary by industry.
Debt to equity shows a company’s solvency. That is important to consider but liquidity is also important to consider when evaluating the safety of a company. Solvency focuses on the company’s ability to prosper in the long run. Liquidity measures its ability to survive in the short run.
It is possible for a company to be solvent but illiquid. Some large financial firms that went bankrupt in 2008 claim they were solvent but simply needed a liquidity injection to survive.
To gauge solvency, focus on short term debt. The short-term debt coverage ratio is found by dividing income from operations by current liabilities. Current liabilities will be found on the balance sheet. Conservative investors should limit buys to companies with a ratio above 2.
Another liquidity indicator is the quick ratio, or the ratio of cash and cash equivalents (excluding inventory) divided by current liabilities which are debts that must be paid over the next twelve months. A quick ratio of 1.0 is a sign of short run financial strength.
Putting It All Together
No one indicator can deliver all of the information an investor needs. That’s to be expected because successful investing is hard work. Combining indicators will show an investor more information. The indicators defined above look at a company’s income statement, balance sheet and statement of cash flows.
Each financial statement includes important information and is worth reviewing for investors who are seeking to minimize risks. If an investor is seeking to maximize income, safety needs to be the first priority and income traps must be avoided. These traps are easy to spot when considering whether to buy or sell.
To avoid income traps, simply avoid excessively high dividend yields. That itself could be a sign of trouble. In 2009, GE offered a yield of 23%.
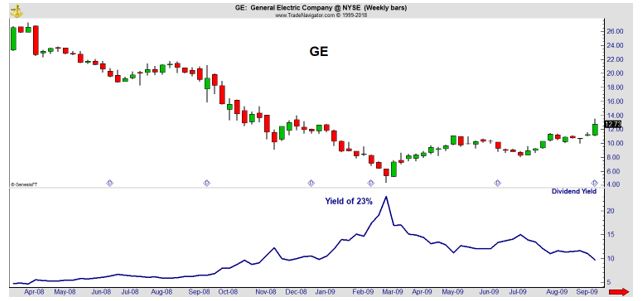
It is obvious in hindsight that was not sustainable. But, in real time, the question to ask is whether or not an investment opportunity looks too good to be true. In this case, 23% a year from a leading company was too good to be true.
That question, combined with the checklist above, should help you avoid dividend cutters and avoid the pain of lower income and a falling stock price.