This Chart Could Show the Biggest Risk of 2019
As is often the case, investors and analysts are studying the stock market in search of clues about the future of the economy. The economy and the stock market have been linked in the mind of investors for more than 120 years.
Chares Dow developed his Dow Jones stock market indexes to track the economy. Dow noticed the swings in the prices of the stock market moved in line with the economy. He developed his index to track that relationship, hoping to forecast the economy.
The original index, which was devised in the late 19th century, included 12 stocks and the 12 largest companies in the country at the time, representing a sweep of the different kinds of industries which were considered the mature-growth companies.
They have changed over time, allowing the index to keep up with the economy.
Yahoo Finance recently noted, “Changes in the Dow during the last 40 years reflect the migration from a manufacturing economy to a tech and service economy.
Walt Disney replaced USX Corp. (formerly US Steel) in 1991. In 1997, insurance conglomerate Travelers and drugmaker Johnson & Johnson came aboard, while Westinghouse and Bethlehem Steel left.
In 1999, chipmaker Intel and software giant Microsoft joined, replacing Goodyear and Union Carbide. Telecom firm Cisco replaced General Motors in 2009. Nike bounced Alcoa in 2013.”
These changes show the move from industrial giants to consumer services to high technology. In that way, the Dow Jones Industrial Average has kept up with the times.
More Important Than Stocks?
But, as the economy changed, the reliance on railroads and other relationships that were evident to Dow changed. One change has been in how consumers behave with a shift from farm to urban environments being an important historical focus in the United States.
As the population moved to the city home ownership rates changed. The very long term rate of ownership is shown in the chart below.
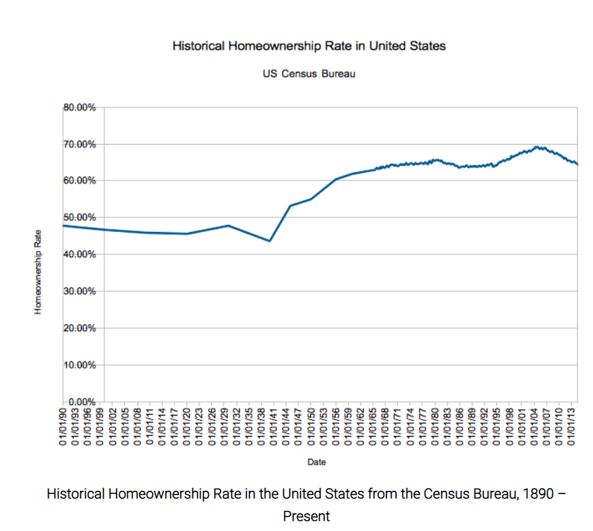
Source: DQYDJ.com
That shift corresponds not just to shifts in where Americans lived but also with shifts in how Americans pay for homes.
MortgageCalculator.org offers insights into the history of how Americans paid for homes:
“Commercial, mutual savings, and property banks expanded into the early 19th century. These lending institutions catered to the unique characteristics of each region they infiltrated. For instance, banks in rural regions issued mortgages to farmers.
The number of banks increased between 1820 and 1860, which also led to an uptick in the volume of loans. During this period, money-lending institutions issued between 55 and 700 million dollars in mortgage loans.
The National Bank Act of 1864 established national bank charters and created greater security for the federal treasury. It also led to the development of a nationalized currency to help finance the Civil War. The nationalized currency replaced state and bank bonds.
The charters allowed for the banking system to expand; however, national banks faced restrictions from directly investing in mortgages and the long-term investment market. In 1893, small state banks started to issue bonds as acknowledgments of debts based on the credit and trust of the debtor alone.
The United States favored these types of mortgages; however, they vastly differed from the loans of today. In fact, the average life of these mortgages only lasted six years and account for less than half of the property’s value.
The United States mortgage market faced disruption during the end of the 19th century. It became a disorganized network of uneven allocated mortgage loans that impacted western farmers negatively. Western mortgage companies sold their loans to Eastern investors.
However, the unsuspecting drought that caused farm foreclosures hurt Eastern investors and caused them to doubt the mortgage investment market. Investors regained their confidence when the West began its recovery and interest rates began to level.
Mortgages featured variable interest rates, short maturities, and high down payments by the early 1890s. Before the Great Depression, homeowners renegotiated their mortgages every year.
The modern mortgage market began to take shape after the federal government intervened during the Great Depression. This intervention resulted in the formation of the Federal Housing Administration, the Federal National Mortgage Association, and the Home Owner’s Loan Corporation.
The Great Depression caused property values to plummet, which destabilized the mortgage market. Homeowners defaulted on their loans when holders refused to refinance their mortgage. Roughly 1/10th of all homes faced foreclosure.
Lending institutions survived by providing government-sponsored bonds to reinstate mortgages in default. It enabled the extension of terms and fixed rates to create self-amortizing loans. Other efforts were made to increase investing confidence in order to stabilize mortgages in poorer areas.
The Second World War introduced provisions written in the G.I. bill for veterans, including the formation of the VA mortgage insurance program. It provided excellent rates and became part of the compensation package of service members.
Lending institutions intended for this to stimulating the housing market. The loan to value ratio increased 95 percent. In addition, the maximum mortgage term extended to thirty years. In 2003, government mortgage institutions accounted for nearly 43 percent of the total mortgage market.”
These factors boosted home ownership, but that trend was reversed after the Great Recession which saw an increase in foreclosures and a decrease in property prices.
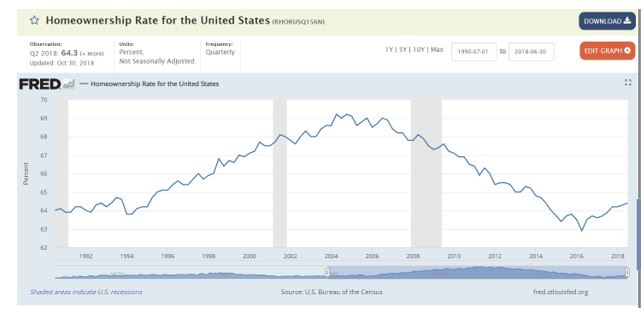
Source: Federal Reserve
Ownership Rates Provide a New Insight On the Economy
With so many home owners, and so many more prospective home owners, home prices now offer important insights into the state of the economy. With prices at new all time highs, there is a message for the economy.
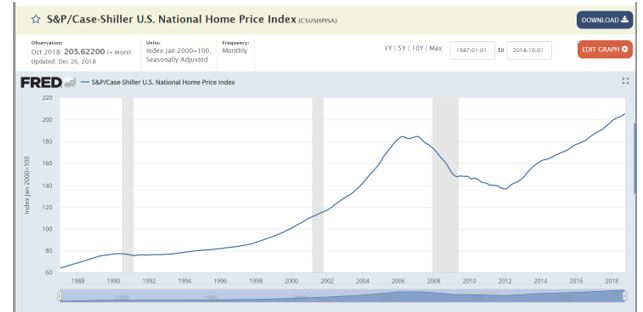
Source: Federal Reserve
The pace of change in the price index has slowed and that could lead to worried home owners. Many of these home owners are also stock market investors and their worries run beyond real estate into the stock market.
Declining home prices, or even prices that aren’t rising as much as expected, could dampen the confidence of investors and that could result in panic when stock market prices decline. That could also lead to selling to preserve wealth as concerns over home values raise worries about retirement wealth.
In short, while railroads once led the economy, it could be that home prices now do so. That could spell trouble in 2019 as the prices of homes level off and potentially decline.