The S&P 500 Gave An Important Sell Signal
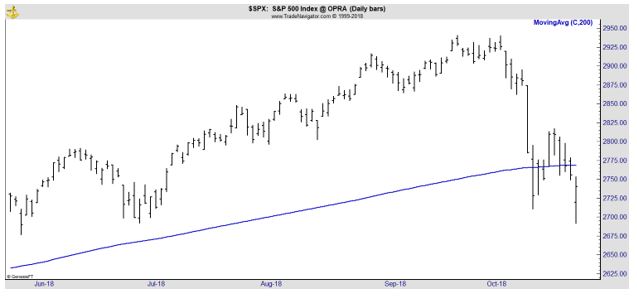
With the recent sell off, many analysts have noted that the S&P 500 dropped below its 200 day moving average (MA). This can be seen in the chart below. The blue line is the 200 day MA and the price of the S&P 500 index did fall below that line.
The question for investors is how important this event is and the answer is not necessarily clear cut.
Digging Into Moving Averages
The MA was one of the first indicators technical analysts developed. They were already widely used when they were written about in the standard textbook of technical analysis, the 1948 edition of Technical Analysis of Stock Trends by Robert Edwards and John Magee.
This was the first edition of their book, which is now in its tenth edition. Edwards and Magee called MAs “automated trend lines” and described how they felt when they first saw this tool in action.
The authors were “still filled with starry eyed ignorance” and were searching for the “sure, unbeatable formula” that would allow them “apply the magic and telegraph our broker periodically from Nassau, or Tahiti…”
The automated trendline looked like their ticket to paradise but, they quickly learned that “it was too good to be true.” While they learned the MA was not all that a trader needed for success, Edwards and Magee did learn that the MA could be useful.
Traders often follow the 200 day MA to assess the direction of the long term trend. They might add the 50 day MA to their charts to track the intermediate term trend and the 20 day MA can be used to determine the short term trend of the market.
These strategies can be useful when applied to a chart, but the usefulness of MAs can be tested to determine whether or not the long trends can be traded profitly.
Putting MAs to the Test
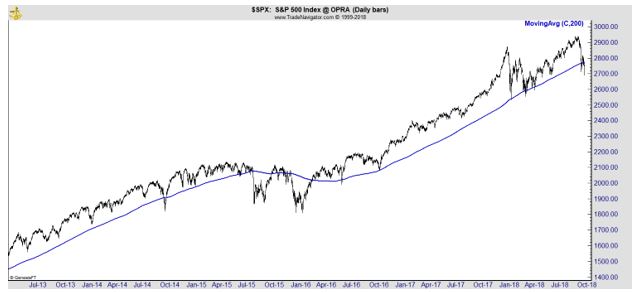
The chart below shows the appeal of MAs in the long run.
The Strategy Is Relatively Simple
Traders buy when the price crosses above the MA and sell when the price closes below the MA. The simplicity of the rules makes this strategy easy to back test with real market data.
We can look back at the last twenty years, staring in October 1993. Testing will be done on the S&P 500 ETF (NYSE: SPY) in order to include dividends in the total return.
A buy and hold investment would have led to a total return of about 288%. The buy and hold strategy suffered a loss of more than 55% in the bear market that ended in 2009.
The trader buying when SPY closes above its 200 day MA and selling when the ETF is below its 200 day MA did not do as well. This trader made 70 trades instead of the 1 trade that the buy and hold investor made. While trading costs are small, they are not zero, so trading will reduce returns somewhat.
The number of trades raises another factor, the possibility of a trader missing a signal. There were an average of a little more than 3 trades a year but the signals occur randomly. There were as many as 9 trades in one year (2000) and no trades in several years.
If a trader misses a signal, the results will differ from the results seen in the back test. The truth is that missing a signal could either hurt or improve results depending on which signal is missed.
Most trades were losing trades. In fact, just 27.5% of the trades were winners, a fairly typical win rate for an MA system.
The low win rate is caused by whipsaw trades. These are trades that last just a few days or a few weeks while prices are in a trading range. These trades can deliver a small gain or a small loss but there are so many of them that whipsaw trades are a serious drag on performance.
Ignoring the cost of commissions in our back test, the 200 day MA delivered a total return of about 135%, less than half of the gains of the buy and hold investor.
Now, the MA strategy did avoid a large part of the bear market of 2008 and 2009 and the worst drawdown was only about 22%. That lower drawdown may be the biggest advantage of the MA. It allows an investor to avoid the worst of a bear market.
The Maximum Drawdown Is A Measure Of Risk
It measures the largest loss in dollar terms. To find the maximum drawdown, the system look at the gain or loss in every trade and finds the largest series of losing trades.
In this case, the maximum drawdown was less than half the largest drawdown of the S&P 500 over that same time period. This is important but an investor must consider whether not giving up half of the gains is worth the price for reduced risk.
This test is typical of how a MA strategy performs. Win rates will typically be near 30% or so and the system will underperform the market in the long run, assuming the long run is sufficiently long.
But, the strategy does reduce risk and helps avoid the largest losses that the stock market might deliver. That highlights a possible work around solution for investors.
It could be worthwhile for an investor to reduce risk when the S&P 500 falls below its 200 day MA. But, rather than waiting for the index to rally back above that MA, the investor could enter if prices move above the 50 day MA. This would require additional rules to avoid large losses but could be the baseline for a strategy.
One of the greatest trades in history, Paul Tudor Jones, uses the 200 day MA as a filter. In an interview with Tony Robbins for the book “Money: Master the Game,” Jones said,
“My metric for everything I look at is the 200-day moving average of closing prices. I’ve seen too many things go to zero, stocks and commodities. The whole trick in investing is: “How do I keep from losing everything?”
If you use the 200-day moving average rule, then you get out. You play defense, and you get out.”
That MA kept Jones from suffering large losses in the 1987 stock market crash and could be useful for many investors as well.