The Truth About Warren Buffett’s Performance
Widely regarded as one of the greatest investors of all time, if not the greatest investor of all time, Warren Buffett is rightfully studied. The reason to study Buffett is to find clues about how he has delivered such extraordinary results. But, the answers have been elusive until now.
Studying greatness is a popular pursuit. But, the purpose of the study has not always been to emulate the success of the individual. For example, many have studied George Washington. The goal is not to become a president necessarily but to understand the leadership and civility which marked his career.
In the case of Buffett, the pursuit seems to be aimed at understanding how to invest like Buffett with the hope of duplicating his success. The truth is it will not be possible to fully duplicate his success.
In part, his success derives from his access to low cost capital and his reputation, factors that will be impossible for an individual investor to duplicate. But, there are still lessons to be learned from Buffett and there are important steps to take that can help improve an investor’s performance.
Buffett’s Performance: By the Numbers
One recent paper summarized important aspects of Buffett’s performance. “A dollar invested in Berkshire Hathaway in October 1976 (when our data sample starts) would have been worth more than $3,685 in March 2017 (when our data sample ends).” Of course, that needs context.
The authors provided that, “Over this time period, Berkshire realized an average annual return of 18.6% in excess of the T-Bill rate, significantly outperforming the general stock market’s average excess return of 7.5%.”
But, we know that high rewards generally come with higher than average risks so it is important to consider the risk of an investment with Buffett. “Berkshire stock also entailed more risk, realized a volatility of 23.5%, higher than the market volatility of 15.3%.” And, again, context is needed.
“However, Berkshire’s excess return was high even relative to its risk, earning a Sharpe ratio of 18.6%/23.5% = 0.79, 1.6 times higher than the market’s Sharpe ratio of 0.49.”
The Sharpe ratio is defined by Investopedia as “the average return earned in excess of the risk-free rate per unit of volatility or total risk. Subtracting the risk-free rate from the mean return, the performance associated with risk-taking activities can be isolated.
One intuition of this calculation is that a portfolio engaging in “zero risk” investment, such as the purchase of U.S. Treasury bills (for which the expected return is the risk-free rate), has a Sharpe ratio of exactly zero.
Generally, the greater the value of the Sharpe ratio, the more attractive the risk-adjusted return.”
Clearly, an investment in Berkshire Hathaway has been more attractive than an investment in the broad stock market. But, there are other ways to measure performance. Beta, for example, compares the volatility of an investment to the volatility of the broad market.
“Berkshire realized a market beta of only 0.69…[and] adjusting Berkshire’s performance for market exposure, we compute its Information ratio to be 0.64.”
The beta of 0.69 indicates that Berkshire Hathaway has had just 69% of the volatility of the broad market. This is generally a positive factor since volatility can cause investors to panic and sell at times when the investment isn’t performing well.
The information ratio is a measure of the risk-adjusted return of a financial security (or asset or portfolio). It is defined as expected active return divided by tracking error, where active return is the difference between the return of the security and the return of a selected benchmark index, and tracking error is the standard deviation of the active return.
It’s a more complex measure of risk adjusted performance than the Sharpe ratio and to understand it, we could use some context. The chart below shows Buffett’s information ratio compared to all funds with a track record of at least 40 years.
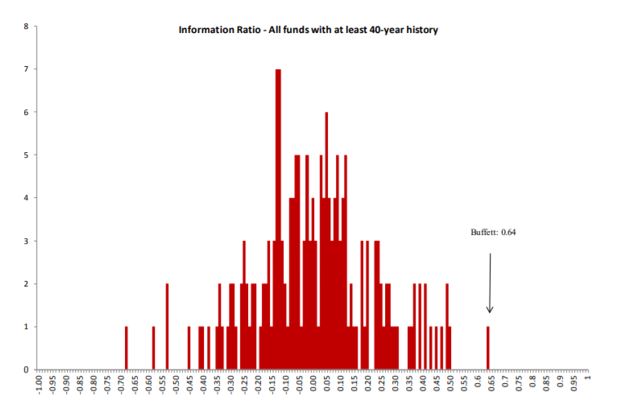
Source: Buffett’s Alpha
What Explains the Performance?
So far, the research has conformed that Buffett is unusually good at investing. The authors also used statistical techniques to search for an explanation of why Buffett has been so successful. These techniques look at various factors and isolate the important components of return.
Not surprisingly, they find that Buffett buys low beta (less volatile stocks) that are high quality stocks. Now, the quality of the company is defined in a specific way.
To define quality stocks, the authors used four broad characteristics that are indicative of safer companies which define the quality to junk factor:
- Profitability: Measured by such metrics as return on equity, return on assets, margins and cash flows
- Growth: Measured by the prior five-year growth in the profitability measures.
- Safety: Measured by both market beta and volatility, as well as by fundamental-based measures such as leverage, volatility of profitability, and credit risk
- Payout: Management’s agency problems are diminished if free cash flows are reduced through higher net payouts (including dividends and buybacks offset by new share issuance).
Using these tools, the authors found a portfolio could even outperform Buffett.
Now, an investor could buy and hold the same companies Buffett owns but that will not beat Berkshire Hathaway. The chart below shows the companies in his portfolio do beat the market, but not as much as a portfolio of the stocks that pass the quality to junk and low beta tests.
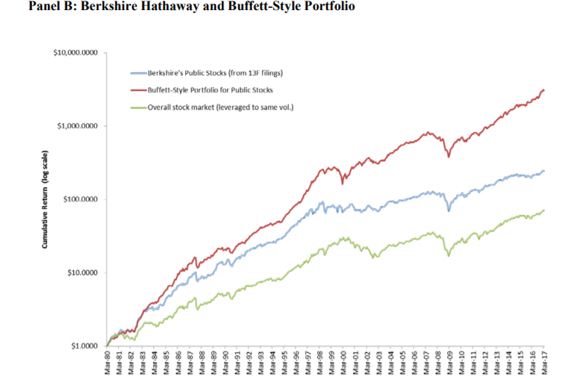
Source: Buffett’s Alpha
To truly duplicate Buffett, an investor would need to use leverage. The authors estimate that Buffett’s leverage is about 1.7-to-1 on average. And, his leverage is less expensive than anyone else would pay at least in part because of his reputation.
The next chart shows that Buffett is able to borrow money and access funds at an extraordinarily low cost.
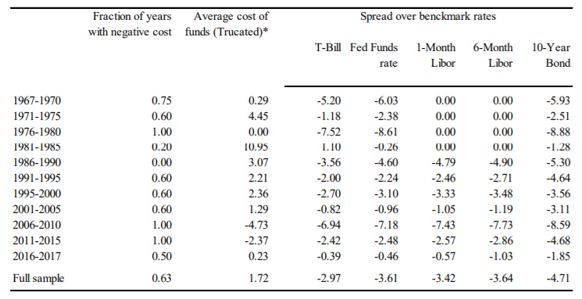
Source: Buffett’s Alpha
That is a portion of the performance that individuals cannot duplicate. But, individuals can buy good companies that have below average volatility (or beta) and approximate Buffett’s style. They don’t need to find the best tech stock or small caps since Buffett has shown large cap stocks can work well.
An investor could obtain leverage with margin but the cost will be greater than Buffett’s cost of funds. However, if the investor is truly focused on the long run, that is a risk that could be worth considering. Although margin is often frowned upon, the results show that leverage can boost returns.
That assumes the leverage is moderate. Excessive leverage, even with a value approach can lead to large risks. But, returns like Buffett will require accepting some risks.