Value and Tech Can Go Together

Value stocks are often thought of as slow growing, older companies. Utility stocks are often a favorite of value investors. Tech stocks, on the other hand, are often thought of as growth stocks. These are companies that grow rapidly and often trade at high prices.
In this case, trading at high prices refers to valuation, using metrics like the price to earnings (P/E) ratio. Higher P/E ratios are justified when the company is growing quickly and could grow into the higher than average valuation.
For example, consider a company that is growing earnings per share (EPS) at 40% a year and reports EPS of $1 in the past twelve months. If the stock is priced at $30, the P/E ratio would be 30 based on last year’s earnings but just 21 based on next year’s earnings.
Rapid growth makes the stock reasonably priced even at a higher than average P/E ratio.
Valuations Matter, But There Are Some Bargains in the Market
Barron’s recently observed that “investors lately seem to have realized that stock valuations matter, even for tech superstars like Amazon.com, with its average forward P/E ratio of 180.9.
Still, tech stocks remain pricey. The average forward P/E of stocks in the Nasdaq 100 is 21.7, compared with 17.5 for the S&P 500, according to FactSet.” They then identified the five cheapest Nasdaq 100 tech stocks and noted a common theme exists in that each of the companies is involved in flash memory.
These are all stocks in the same industry and investors should not think of these five as a diversified portfolio.
Micron Technology, Inc. (Nasdaq: MU)
MU provides semiconductor systems worldwide. The company operates through four segments: Compute and Networking Business Unit, Storage Business Unit, Mobile Business Unit, and Embedded Business Unit.
It offers products for computers, servers, networking devices, communications equipment, consumer electronics, automotive, and industrial applications; lower power DRAM products for smartphones, tablets, automotive, laptop computers, and other mobile consumer device applications.
The company also provides NAND products, which are electrically re-writeable, non-volatile semiconductor memory, and storage devices; client solid-state drives (SSDs) for notebooks, desktops, workstations, and other consumer applications; enterprise SSDs for server and storage applications; cloud SSDs; and multi-chip package and managed NAND products.
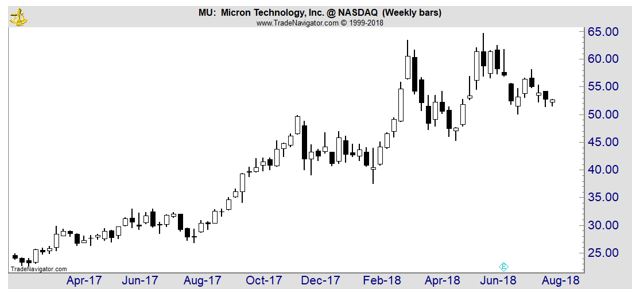
With a P/E ratio of 5.2, MU appears attractive. But, investors in the flash memory-chip maker worry about competition from cheaper Chinese rivals that could flood the market and erode prices. Value investors have demanded that Micron shake off the doldrums, but the stock remains at a steep discount to other tech stocks.
Western Digital Corporation (Nasdaq: WDC)
WDC develops, manufactures, and sells data storage devices and solutions worldwide.
It offers performance hard disk drives (HDDs) that are used in enterprise servers, data analysis, and other enterprise applications; capacity HDDs and drive configurations for use in data storage systems and tiered storage models; and enterprise solid state drives (SSDs), including NAND-flash SSDs and software solutions that are designed to enhance the performance in various enterprise workload environments.
The company also provides client solutions that consist of HDDs and SSDs embedded into external storage products; removable cards for use in mobile phones, tablets, imaging systems, still cameras, action video cameras, and security surveillance systems; USB flash drives used in computing and consumer markets; and wireless drive products.
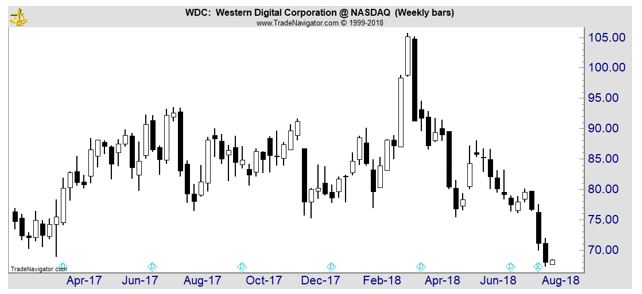
Western Digital has a P/E ratio of 6.7. Analysts note that the company has a declining hard-disk-drive unit and a flash business facing the same pressures as Micron and point out that discouraged investors haven’t bought despite 200% earnings growth over the past two years.
The concern could be that WDC faces a declining, competitive market.
Seagate Technology plc (Nasdaq: STX)
STX provides data storage technology and solutions. The company manufactures and distributes hard disk drives, solid state drives and their related controllers, solid state hybrid drives, and storage subsystems.
Its products are used in enterprise servers and storage systems applications; client compute applications, primarily for desktop and mobile computing; and client non-compute applications, including various end user devices, such as portable external storage systems, surveillance systems, network-attached storage, digital video recorders, and gaming consoles.
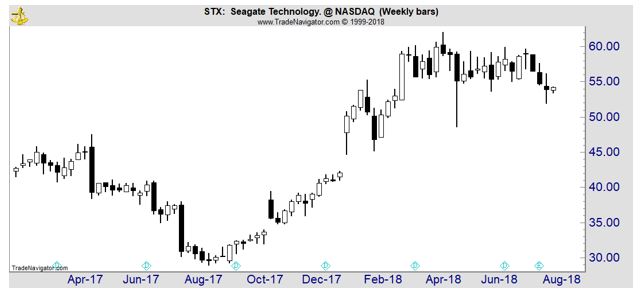
Seagate Technology is trading with a P/E ratio of 10.2. Seagate’s sole focus is a shrinking hard-disk-drive market it shares with WDC. Its lack of a flash business might be the reason its P/E beats WDC’s.
Lam Research Corporation (Nasdaq: LRCX)
LRCX designs, manufactures, markets, refurbishes, and services semiconductor processing equipment used in the fabrication of integrated circuits worldwide.
The company offers thin film deposition products, including SABRE electrochemical deposition products for copper damascene manufacturing; ALTUS systems to deposit conformal atomic layer films for tungsten metallization applications; VECTOR plasma-enhanced chemical vapor deposition (CVD) and atomic layer deposition systems to deposit oxides, nitrides, and carbides for hardmasks, multiple patterning films, anti-reflective layers, multi-layer stack films, and diffusion barriers; and Striker atomic layer deposition systems that deliver conformal dielectric films for spacer-based patterning and liner applications in various advanced memory and logic structures.
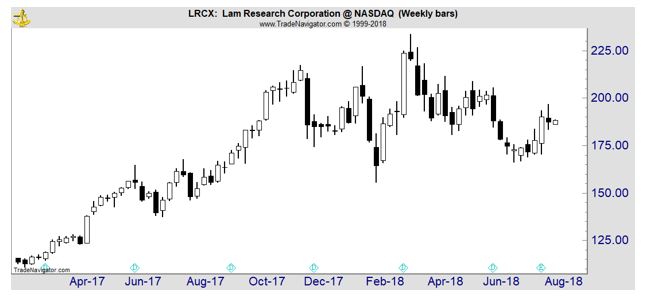
Lam Research has a P/E ratio of 10.9. Despite growing revenues and earnings, investors remain wary and analysts are uncertain as to why.
Applied Materials, Inc. (Nasdaq: AMAT)
AMAT provides manufacturing equipment, services, and software to the semiconductor, display, and related industries worldwide.
The Semiconductor Systems segment develops, manufactures, and sells a range of manufacturing equipment used to fabricate semiconductor chips or integrated circuits.
The Applied Global Services segment provides integrated solutions to optimize equipment and fab performance and productivity, including spares, upgrades, services, remanufactured earlier generation equipment, and factory automation software for semiconductor, display, and other products.
The Display and Adjacent Markets segment offers products for manufacturing liquid crystal displays, organic light-emitting diodes, and other display technologies for TVs, personal computers, electronic tablets, smart phones, and other consumer-oriented devices, as well as equipment for flexible substrates.
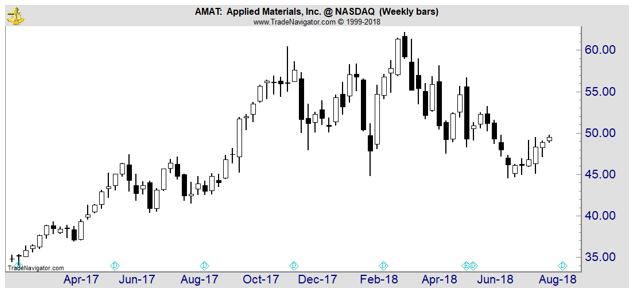
AMAT has a P/E ratio of 11.9. Analysts worry that Applied Materials competes with Lam to supply flash-memory engineering equipment. Sales growth has not been able to overcome fears of a declining market.
These stocks offer value in a potential growth sector and could be attractive to investors seeking growth or value.