Trading the Inverted Yield Curve
One of the biggest stories for investors in the past few weeks has been the inverted yield curve. As Investopedia explains,
“An inverted yield curve is an interest rate environment in which long-term debt instruments have a lower yield than short-term debt instruments of the same credit quality. This type of yield curve is the rarest of the three main curve types and is considered to be a predictor of economic recession.
A partial inversion occurs when only some of the short-term Treasuries (five or 10 years) have higher yields than 30-year Treasuries. An inverted yield curve is sometimes referred to as a negative yield curve.
Historically, inversions of the yield curve have preceded many of the U.S. recessions. Due to this historical correlation, the yield curve is often seen as an accurate forecast of the turning points of the business cycle.
A recent example is when the U.S. Treasury yield curve inverted in late 2005, 2006, and again in 2007 before U.S. equity markets collapsed. The curve also inverted in late 2018. An inverse yield curve predicts lower interest rates in the future as longer-term bonds are demanded, sending the yields down.”
The most recent inversion is shown in the chart below.
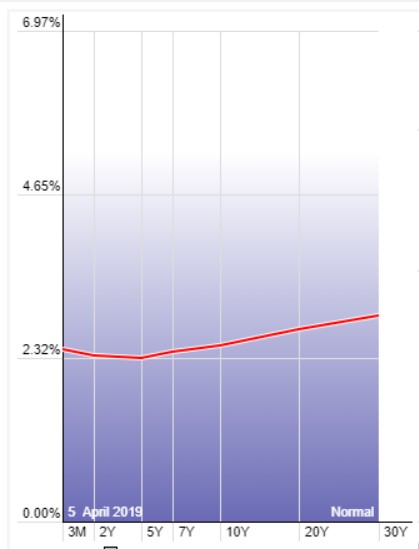
Source: StockCharts.com
Trading based on the Inversion
This event creates potential risks for investors. But, as in all investment environments, there are also possible rewards. Barron’s recently noted,
“There was a seismic shift in investor psychology when the yield curve inverted [recently]. A trifecta of events drove investors to safety in long-term Treasuries, causing yields to fall lower than that of shorter-dated Treasuries—what is called a yield-curve inversion.
This recession signal was flashing red, but there was—and still is—green to be made.
More than a handful of long-duration bond exchange-traded funds, such as the iShares 20+ Year Treasury Bond ETF (NYSE: TLT) and the Vanguard Long-Term Bond ETF (BLV), hit new highs [after the inversion].” A chart of TLT is shown below.
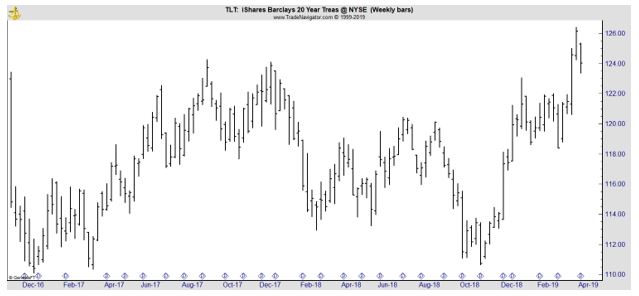
Barron’s continued, “When the yield curve inverted, the longer the duration, the greater the boost, and the more likely that the ETFs were going to make new highs, says Will Geisdorf, the ETF strategist at Ned Davis Research.
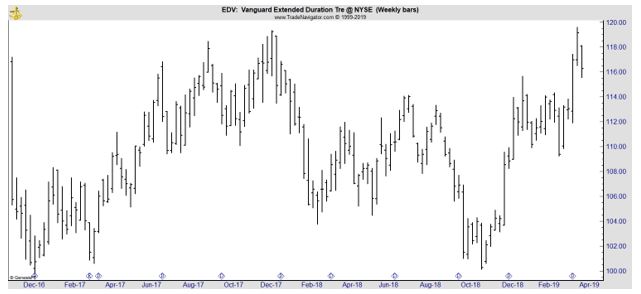
To bet on a flatter yield curve, the classic strategy for bond investors is to have a “barbell”—a fixed-income portfolio mostly made up of positions at the short and long end.
That means cash or money market funds, which yield more than 2% with very low risk, on one end, and longer-dated Treasury ETFs, such as Vanguard Extended Duration Treasuries (NYSE: EDV) and Pimco 25+ Year Zero Coupon U.S. (NYSE: ZROZ), on the other.” The chart of EDV is shown below.
This strategy can deliver significant gains.
“With perfect hindsight, this barbell positioning would have been the bet to make when 10-year Treasury yields hit a peak at 3.23% in early October, as prices rose on longer-dated bonds.
The Vanguard Extended Duration Treasuries ETF, which invests in bonds dated 20 years or longer, returned 16% from Oct. 5 through [late March]. The iShares Short Maturity Bond ETF (NEAR) returned 1.3% over the same period.
The ProShares UltraShort 20+ Year Treasury ETF (TBT), which bets on long-term bond prices falling, thereby increasing yields, fell 19%.”
However, the next few months could be more difficult, “The barbell might be close to played out. The yield curve may begin to steepen if the yield on the 10-year Treasury note bottoms where it has been recently, at 2.37%, as prices grew too rich for investors.
That shows up in the performance of two exchange-traded notes that aim to execute specialized, and inverse, strategies in one product—the iPath U.S. Treasury Flattener ETN (NYSE: FLAT) and the iPath U.S. Treasury Steepener ETN (NYSE: STPP).
Betting on what the pros call a steepener trade could be useful in active funds, says Anne Mathias, who manages more than $720 billion in active fund assets in Vanguard’s fixed-income group.
Mathias does not see a recession on the horizon, but expects the economic environment to improve in the back half of the year as trade tensions ease.
“There is a maxim that the Federal Reserve causes recession by hiking interest rates too quickly, but they are communicating a policy approach that diverges from historical tightening cycles,” she says.
The market has begun to digest the Fed’s new approach, which the central bank has had difficulty communicating, she adds. “The Fed has told us they want to encourage inflation to a point where it rises above the 2% average. It’s too early to declare inflation dead and gone,” Mathias says.
With a “bullet” strategy, in which investors own more intermediate-term bonds and eschew the short and long ends, can work if the yield curve steepens; prices for intermediate-term bonds rose [after the inversion].
That could become a more attractive strategy if short-term rates fall, but that would require the Fed to actually cut rates—on which the federal-funds futures market places a 70% probability by year end, according to the CME FedWatch site.
For now, going agnostic with a market-neutral ETF like the iShares Core U.S. Aggregate Bond (NYSE: AGG) could be the better bet.”
In summary, as there almost always is, there is a lack of consensus among investment experts.
Where does that leave individual investors? While there’s no consensus and certainly “no guaranteed to be correct” answer, now could be a time when diversification can help reduce risk. Betting on just one strategy could result in large losses. Diversification can deliver more balanced results.
It could also be beneficial to decrease risks. Investors who have all of their assets in stocks could consider this to be an ideal time to take some profits or add fixed income assets to their portfolio.
Increasing cash could be the best strategy in an uncertain market, one that reduces risks even if it reduces the potential gains of a bull market.