Trade A Sector Rotation Strategy

Traders know that stocks move up and down. The same is true for the market in general and for sectors and industries. In general, sectors are broad groups and industries are more specific collections of companies.
As an example, Walmart is in the food and staples industry and in the hypermarkets and super center industry according to some classifications. Other classifications are possible, depending on the data provider.
That fact highlights an important point. When building a sector strategy, it is not necessary to focus on precise definitions. It is important to find a data source and to use that data source consistently and with discipline.
Defining Sector Rotation Strategies
Sector rotation strategies are based on the idea that traders rotate from one group. Some theories contend this is a natural part of the business cycle and the sector with the strongest performance is tied to where the economy is in the business cycle.
The business cycle is the expansion and contraction of the economy. It is measured with data like the GDP report and the employment report and other economic data series offer insights into where we are in the cycle.
But, the economic cycle is impossible to measure in real time. GDP data, for example, is released once a quarter and is frequently revised. In fact, economists expect the data to be revised.
The economic cycle is also an imprecise construct. In math or in physics, a cycle is strictly defined by time and once the down trend of the cycle begins, that trend continues until its scheduled conclusion. In the economic cycle, there is no definite time between tops and bottoms.
There is also no defined magnitude of the size of peaks and troughs. And, it is not predetermined. The cycle can start and stop and behave in unexpected and unpredictable ways.
Despite its approximate nature, the business cycle is still useful for traders. The fact is that some sectors or industries do better at different times. And, the leadership in the market varies from sector to sector. This gives rise to the sector rotation strategy.
The chart below is typical of the ones used to define the strategy. It shows a business cycle and imposes an expected pattern of which sectors will do best in each part of the cycle.
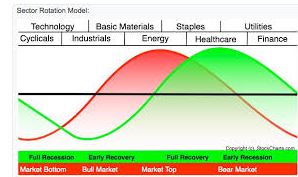
Source: StockCharts.com
The next chart presents the same type of information in a different and perhaps more understandable style.
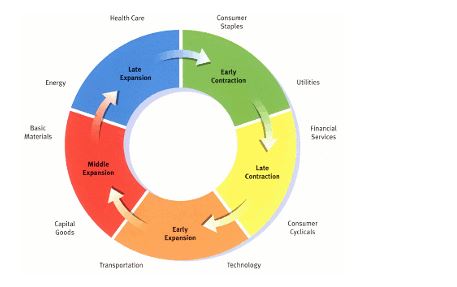
Source: StockCharts.com
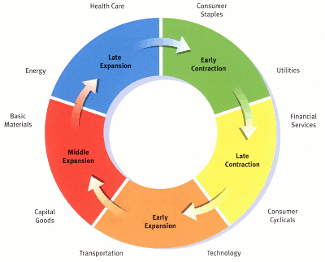
What’s important is the idea that different sectors lead at different times and traders could potentially benefit from that.
Dynamic Markets Require a Dynamic Strategy
The charts above give the impression that there will be a time when traders should sell health care, for example, and but consumer staples. When consumer staples are sold, the investor would rotate into utilities.
This is, of course, a theory. In practice, the market does not behave so predictably. That means many traders have developed dynamic strategies to decide when to rotate between sectors. We will build out a simple example of a strategy.
While there are a number if data sources that a trader could use, we will look to FinViz.com, a free site that has a screening tool that could be used to trade this strategy. The rules for the strategy are shown in the next chart and we will explain the concepts in the next section.
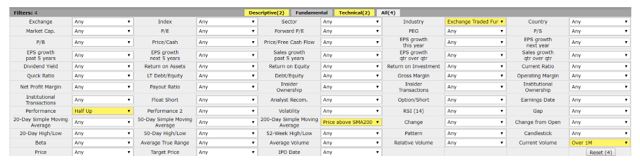
Source: FinViz.com
Specific Strategy Rules
We have elected to consider only exchange traded funds (ETFs). An ETF holds dozens or hundreds of individual stocks. That reduces the volatility of the holdings. A trader could also use individual stocks instead but that would lead to higher expected volatility.
Volatility in general terms is the size of the expected price swings. Higher volatility could mean larger potential rewards and higher potential risks. Each trader should consider their risk tolerance in deciding exactly how much volatility they are willing to accept.
Next, we required minimum trading volume of 1 million shares. That is a liquidity filter to make it easy to trade. By requiring a relatively large amount of volume, we are doing all we can ensure that we can trade at a reasonable cost under any market conditions.
We then get to the heart of the rules. We require the ETFs to be up in the last six months and we require the closing price to be above the 200 day moving average. This is our complete set of rules that will determine which ETFs to trade.
Recently 44 ETFs passed this screen. That is too many to trade for many individuals. So, we next selected just the top five. Their ticker symbols are shown in the next figure.
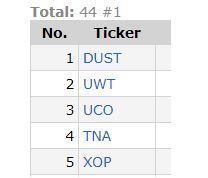
Source: FinViz.com
These ETFs could be bought. Remember, this is just one approach and we are searching for the best performers. You could tailor this to your risk preference.
Now, the decision on when to sell must be considered. One approach is simply to run this screen once a month. If an ETF is no longer among the top five, it could be sold and replaced with the top performing ETFs that are not currently in the portfolio.
There is no reason that one month holding periods need to be used. Research completed in the academic community has shown that this approach could be successful with any time period from about one month to one year. Rerunning the screen every three months is an approach that could be considered.
This is a relatively simple sector rotation strategy and there are a number of ways that it could be refined. However, all will have risks since the top performing ETFs in a bull market can, and often do, reverse sharply. This means volatility will still be high, even with ETFs.
However, in the long run, strategies like this one that are based on momentum have been shown to beat the market. That means this could be a useful strategy in a retirement account which has a long term outlook. Sector rotation could be a valuable addition to long term, and even short term traders.