Reduce Your Risk With This Strategy

When searching for trades, investors tend to think a great deal about what they should buy. This is important but it’s also important to ask, “how many shares of stock should I buy?” The same question applies to exchange traded funds (ETFs) or other trading vehicles.
It’s an important question to consider. According to some experts, this is the most important question to answer. Yet, it’s a question many individual investors fail to consider as they make their trading decisions.
Rather than asking this question, some investors just buy the same number all of the time. This was an especially common approach years ago when companies would often split their stock when the price moved above $100 a share. Then, investors might routinely buy 100 or 50 shares in each trade.
Now that splits are less likely, the investor might look at their account and use all available cash to decide how many shares they should buy. Or, they might always use the same dollar size per trade, perhaps always buying $1,000 worth of stock.
To do this, they divide the investment by the share price. If a stock is trading at $22 a share, they would be able to buy 45.45 shares. Since it’s not typical to buy a fractional number of shares, the investor might round down and buy 45 shares. More aggressive investors might round up and buy 46 shares, using margin borrowing at times to increase their exposure.
There could be a better way to make this decision that involves using market data to balance position sizes by their risk rather than their share count or dollar amount.
Let Risk Determine Position Size
Risk, in the financial markets, is often associated with volatility. The more volatile a stock is, the more risky it is under this approach. This makes sense since volatility is associated with the size of the typical price move. A stock with volatility could make a large move quickly, and that could lead a large loss.
An indicator that is designed to measure the volatility of an individual stock is the average true range indicator (ATR).
The ATR is customized to the personality of each stock. The true range (TR) is the distance between the high and low accounting for any gaps that occur in trading. It’s calculation is summarized in the chart below.
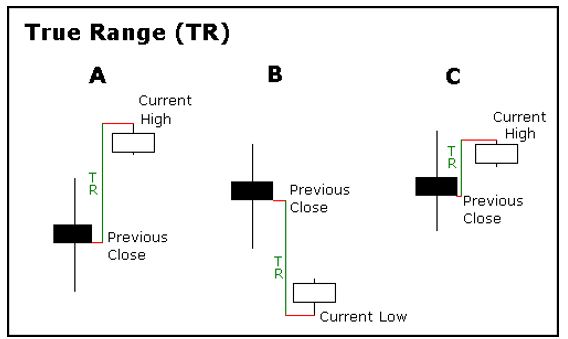
Source: StockCharts.com
A 14-day average of the true range is an indicator of a stock’s normal movement. Like almost all technical indicators, the ATR is readily available on a number of web sites. It’s often possible to customize the length of the indicator so that you could use a 10-day or 10-week ATR if you choose to.
The ATR provides a measure of volatility and that can be used to determine a type of risk equalized position sizing.
The Calculations
Consider the $22 stock we looked at above and decided to buy 45 shares of based upon a $1,000 trade size. We would use a 20% stop loss, risking about $200 per trade on that stock.
Now, assume the ATR is equal to $1. We still want to risk $200 so we now need to determine how many shares to buy. We can define a large move in the stock as being equal to 3 times the ATR, or a move of more than $3 in this stock. If the price falls by more than $3 we want to sell.
In this case, with a risk of $200, we could buy 66 shares. That is about equivalent to a 20% stop loss on 45 shares of the stock. Of course, rounding is affecting these values. Buying 45 shares using the equal position sized approach would lead to missing out on potential gains if we are right about the stock.
That would be because we owned too little of the stock. Notice that with the ATR we are taking the same amount of risk, in theory, as we did by buying equal dollar amounts. In practice, risk can and does spike suddenly and that possibility is impossible to eliminate.
Now, what if the ATR is equal to $3? A 3 ATR move is now $9 and dividing the $200 risk by $9 tells us to buy just 22 shares. Buying 45 shares using the equal position sized approach would lead to too much risk in our account.
If the volatility was smaller, and the ATR was just $0.50, we could buy more. In that case, the number of shares to buy would be equal to $200 by $1.50, or 3 times the $0.50 ATR. That would be 133 shares, or more than $2,900 worth of the stock.
In a $10,000 account, low volatility stocks like this could be too large of a portion to hold comfortably. This would be a position size of almost 30%. That indicates small traders may want to focus on stocks with some degree of risk to allow for adequate diversification, a slightly counterintuitive result.
The ATR can change over time as the chart below shows.
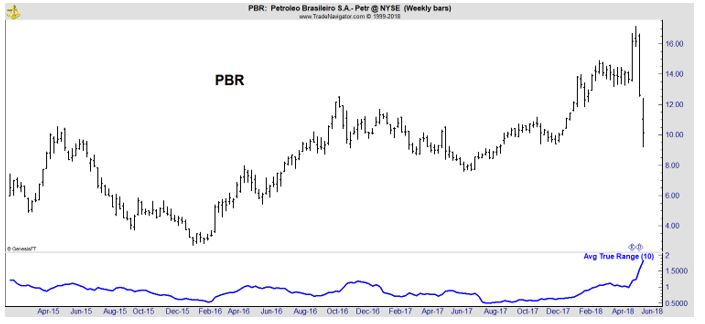
In this chart, a large down move led to a sharp rise in the ATR. This would likely trigger a sell order.
Likewise, a large up move can also increase the value of the ATR as the next chart shows.
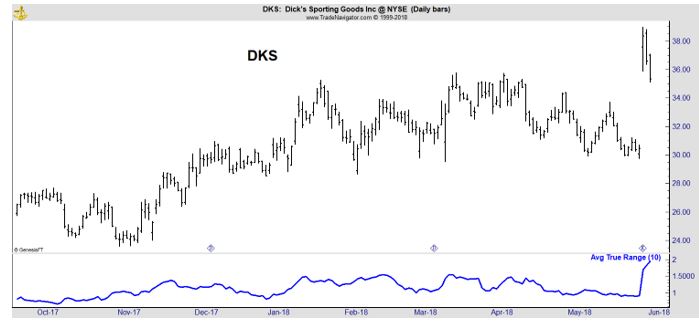
This indicates a trader should probably decrease exposure to the position to limit the risk of the now more volatile stock.
The ATR is an important tool to consider using. It can help determine the best position size to limit risks, while potentially maximizing returns that are consistent with the level of risk. But, it is a dynamic tool that will require updating if it’s employed in portfolio management.
It’s a flexible tool and can be applied to daily or weekly data, depending upon an individual’s preferred trading time frame. The parameters can be changed, again to accommodate a trader’s preferred approach to the markets.