Macrotrends Point to These Stocks as Potential Winners
Traders often focus on the daily moves in the stock market. They might look at the change in the S&P 500 index to determine whether or not the trend is up or down. They might then look at the list of most active stocks to find trade candidates.
This is certainly an approach to the markets that can work. But, it is also an approach that can be labor intensive and, unfortunately, many individuals don’t have as much time to spend on market analysis as they thought they did. In that case, when they discover a lack of time, they can face losses.
Losses often result when traders are unable to follow their positions or when they lack the time to react to the market news.
Longer Term Trends Can Be Profitable
If time is a concern for a trader, it could be better to step back and identify longer term trends. This can be done, for example, with a weekly chart.
The weekly chart of the dollar index is shown below. The predominant trend is down, for now. This is visible in the long term, but less obvious in short term analysis.
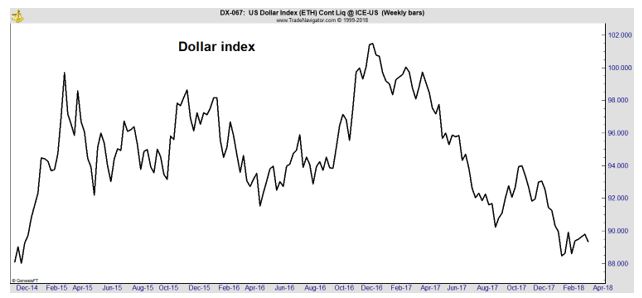
Now, the dollar might seem esoteric for analyzing stocks, but, again, traders should keep ideas simple. At the highest level, according to the research firm FactSet, a declining dollar is bullish for stocks with exposure to foreign markets.
The firm writes, “companies with higher global exposure are expected to benefit from the tailwinds of a weaker U.S. dollar and higher global GDP growth.”
And, this leads to a specific trading strategy, “Based on current estimates, are S&P 500 companies with higher global revenue exposure expected to outperform S&P 500 companies with lower global revenue exposure in terms of earnings and sales growth for Q1 2018?
The answer is yes.”
To find that answer, the firm used FactSet Geographic Revenue Exposure data (based on the most recently reported fiscal year data for each company in the index).
“For this particular analysis, the index was divided into two groups: companies that generate more than 50% of sales inside the U.S. (less global exposure) and companies that generate less than 50% of sales inside the U.S. (more global exposure). Aggregate earnings and revenue growth rates were then calculated based on these two groups.”
Results of this analysis can be summarized in the chart which is reproduced below.
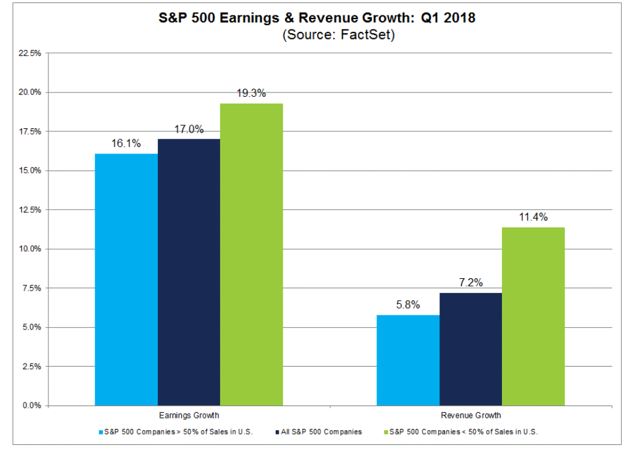
Source: FactSet
As the chart shows, the estimated earnings growth rate for all of the companies in the S&P 500 for the first quarter of this year is 17.0%. But the growth rate is not distributed evenly.
For companies that generate more than 50% of sales inside the U.S., the earnings growth rate is 16.1%. For companies that generate less than 50% of sales inside the U.S., the earnings growth rate is 19.3%.
A similar pattern of growth is seen in sales estimates. The estimated sales growth rate for the companies in the S&P 500 for the first quarter of this year is 7.2%. For companies that generate more than 50% of sales inside the U.S., the sales growth rate is 5.8%. For companies that generate less than 50% of sales inside the U.S., the sales growth rate is 11.4%.
Sectors and Stocks to Watch
The S&P 500 stocks are subdivided into 11 different sectors. The gains in earnings and sales are again not evenly distributed. The Information Technology, Energy, and Materials sectors are expected to be the largest beneficiary of the trends associated with the declining and global GDP growth.
To obtain exposure to this trend, investors could consider exchange traded funds (ETFs). An ETF provides exposure to a group of stocks in a particular sector or to all of the members of an index. Specific ETFs to consider would include:
- Vanguard Information Technology ETF (NYSE: VGT)
- Vanguard Energy ETF (NYSE: VDE)
- iShares US Basic Materials ETF (NYSE: IYM)
Of course, it is also possible to trade this macroeconomic theme with individual stocks. While it seems like it could require extensive research to find the portion of sales and earnings individual companies obtain in foreign countries, indexes have already completed the research.
The S&P 500 Foreign Revenue Exposure Index is designed to measure the performance of companies in the S&P 500 with higher than average revenue exposure to regions outside the U.S. This index divides the components into two groups, those with high exposure and low exposure to foreign sales.
In this way, the index is similar to the more familiar indexes that segment the index components into value or growth. To form a value index, an index provider usually sorts the companies in the index by a metric such as the price to earnings (P/E) ratio.
The P/E ratio of all companies is found, and the list is then sorted from the lowest value to the highest. The lowest half of the values are assigned to the value index while the highest half of the values are assigned to the growth index.
In the case of foreign sales, the S&P calculates the foreign revenue exposure of all of the companies in the index and sorts from the highest to the lowest. The list of the ten companies with the highest exposure are shown in the chart below.
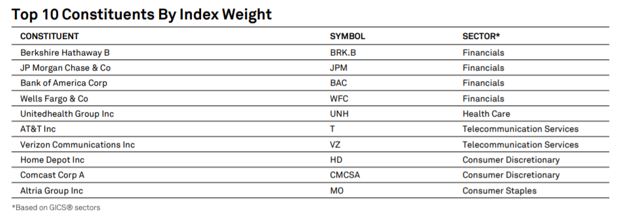
Source: S&P 500 Revenue Exposure Index Factsheet
These companies could benefit from continued weakness in the dollar and from continued growth in overseas markets. Some of the companies on the list may be a surprise. But, the data is not biased as our perceptions often are.
This list is prepared by Standard & Poor’s and is based on the data they provide to professional investors.
Of course, this list should serve as a starting point for research and additional data should be considered before making a buy decision. For example, an investor might want to check for a bullish chart pattern or for an upward trend in the stock before buying.
Investors could also use an additional valuation metric, such as the P/E ratio or expected earnings growth.
But, this list could benefit from important trends that aren’t readily apparent in the day to day market action.