What Investors Need to Know About Oil’s Bear Market

Oil is in a bear market. That’s using the official definition of a bear market which requires a price drop of 20% from a high. This could be significant because declines in oil have been seen before several recessions.
For investors, that raises the question of whether or not oil’s decline forecasts an economic contraction. Before attempting to answer that question, it could be best to analyze the state of the current market and then review the actual price history of oil.
The Current Decline
Crude oil prices can be measured with a number of benchmarks. Shown below is a chart of crude oil futures, one of the widely accepted benchmarks based on market prices. The price is more than 20% below the most recent high and that does meet the formal definition of a bear market.
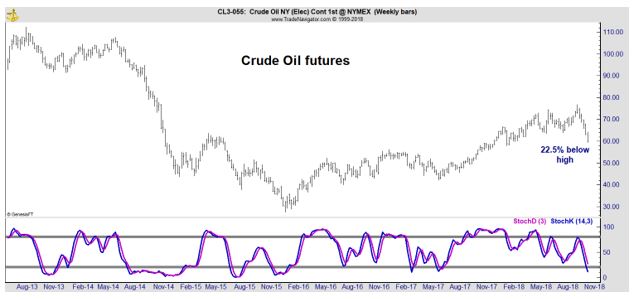
At the bottom of the chart is the stochastic indicator, a popular momentum indicator. Momentum tends to oscillate between extremes, moving from oversold to overbought extremes. Oversold conditions develop when prices fall rapidly as they have recently.
We tend to see market prices move to an extreme and stay there for some time. In the current market, the price has just recently reached an oversold level. That indicates we can expect more weakness in the price of oil as the market becomes more oversold.
Another way to measure the extreme degree of bearishness in the current market is to consider the length of the current losing streak. According to MarketWatch, last week, the market recorded “its 10th consecutive decline and matching the longest skid for the contract since a similar stretch from July 18-July 31 1984, according to Dow Jones Market Data.
Bespoke Investment Group pegs the losing stretch as the longest skid since at least 1983, noting that “there has never been a streak of more than 9 straight days where crude oil traded down on the day.”
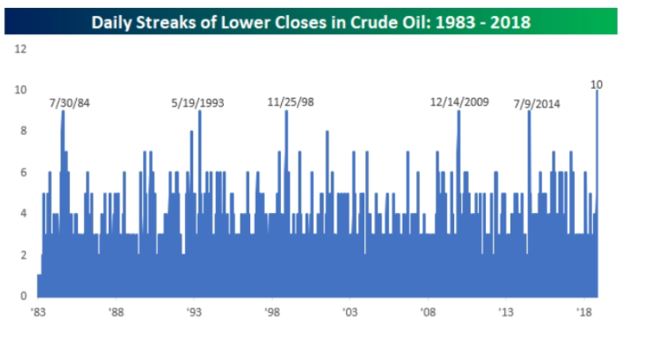
Source: Bespoke via MarketWatch
Notice that there are differences in the data, with one source noting it is the longest streak and another noting that the decline ties the record for the longest streak. This highlights the issue we raised at the beginning of this article that different benchmarks are used for this market.
By any market the current market is weak. Understanding why could help assess whether weakness is likely to be pointing to a recession.
MarketWatch added that the decline is at least partly due to “rising production and a softening in U.S. oil sanctions on Iran, that included waivers for big crude importers like China, which helped to contribute to a whipsaw lower for oil prices.
Indeed, just five weeks ago, oil futures had put in their highest prices in years. Lingering concerns about the global economy and expectations for sluggish corporate earnings in the future also have added to the downbeat mood in the oil industry.”
The analysis points to the fact that no one is certain as to why the decline is occurring. History shows the decline is in fact relatively normal.
History Shows Bear Markets Are Relatively Common
The next chart shows the frequency of 20% declines in the oil market. At the bottom of the chart, the blue line reverses whenever prices move at least 20%.
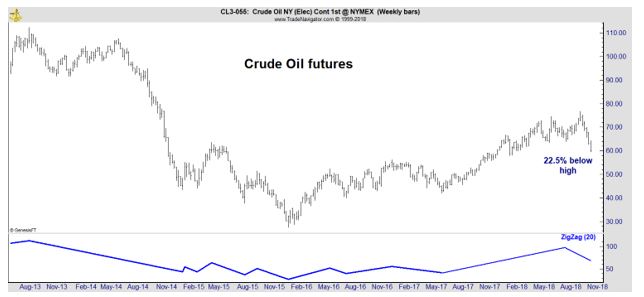
The current decline marks the seventh time oil prices have fallen by at least 20% in the past five years. In other words, large swings in oil prices are relatively common.
The concern that a decline in oil prices is a signal of a impending recession results from two examples. In 1991 and in 2008, there was a decline in oil prices coincident with a slowdown in the economy. Both were unique in their circumstances.
In 1991, oil prices had been rising sharply ahead of the first Gulf War and the price of oil more than doubled in three months late in 1990 as the buildup to the war was underway. The collapse in prices was due to the fact that the war did not affect the supply of oil as much as feared.
There was a recession near the period of time but oil prices were not reflecting the economy in 1990 and 1991 as much as they were reflecting news related to the war.
In 2008, the price of oil raced higher on optimism that the economy was growing but then, the global financial crisis struck. That crisis was sudden and unprecedented. The global economy suffered its steepest decline since the Great Depression according to some analysts.
These two instances create the concern that the price of oil is linked to recessions. It could be, but oil has moved down many, many times without creating an inflation. In fact, the two oil busts that led to recessions were not caused by oil prices but were instead unique.
That leads us back to the current market. Oil prices are in a bear market and the economy does appear to be slowing. However, the decline in oil is most likely due to a mismatch between supply and demand.
Investors should not get caught up in trying to project the probable path of the stock market based on the price of oil. That relationship works at times but is rarely accurate.
Instead, investors should look at the stock market and economic news. For now, economic news is bullish and the stock market is weak. This is consistent with an impending recession.
The stock market usually peaks before the economy turns down. The decline in stocks could be pointing to an economic slowdown in the next year or so. Economic news is generally strong until the recession strikes and by then, the stock market is likely to be down significantly.
There are a number of reasons to be concerned about the stock market. However, the price decline in the oil market is not one of them. Oil and stocks tend to be less correlated than headlines would appear to indicate.
In the end, the most important lesson for investors could be to trade according to their rules and ignore the warnings of a bear market they see in headlines and on CNBC.