New Highs Lead to…

Investors seem to become concerned when stock market indexes reach new highs. There is, of course, good reason for that.
The market crash in October 1987 came after the S&P 500 Index reached new highs. That bear market in 2008 also came after the index reached new highs and so did the bear market in 2000 that followed the internet bubble.
The chart below shows new all time highs with green bars marking those prices. The chart does show that bear markets have followed new highs, sometimes. But, it shows much more than that.
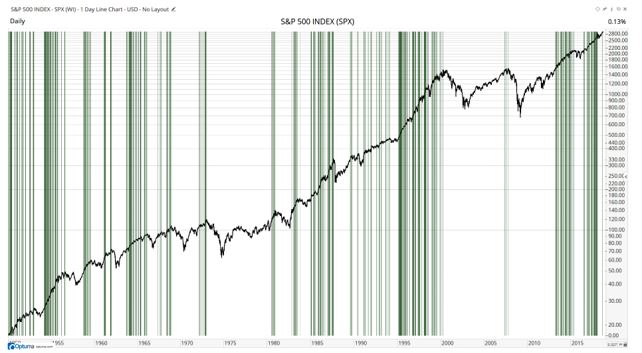
Source: Optuma.com
New Highs Often Follow New Highs
The chart above shows that new highs often seem to cluster, in other words new highs are often followed by additional new highs. This can extend for years at a time. Consider the time period from 1995 to 2000 when new highs simply built on each other.
Based on the chart above, it is obvious that new highs could lead to a bear market or another new high. The analysts at Optuma Research addressed this question with a quantitative test. They concluded,
“[Friday]’s high was the 1,274th new all-time high using data since 1950 (ie not including the historical hypothetical data calculated before the index existed).
The Signal Test results tell us that the mean return of the previous 1,273 new highs was 4.9% six months – approximately 132 trading days – after each signal, with a probability of gain of 77%. In other words, you would expect three wins for every loss if you took an entry on every new high and would gain, on average, almost 5% six months later.”
The Signal Test is shown next.
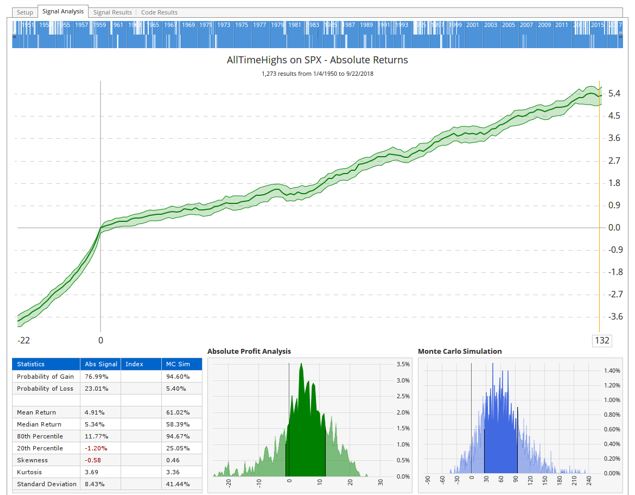
Source: Optuma.com
As explained, “If you look at the left of the chart above the -22 represents 22 days before each signal (about a month of trading). The steep incline leading up to Day 0 (ie each entry) illustrates the strong momentum going in to each new high.
Of course, this doesn’t mean that the index will be 5% higher in 6 months’ time, but history tells us that new highs are certainly nothing to be scared of.”
Stocks Show a Similar Pattern
Many investors are familiar with William O’Neil who began his career as a stockbroker in 1958 and according to Investopedia, “was an early proponent of computers as a tool in investment. Based on his research, O’Neil developed the CANSLIM strategy, which led him to outperforming all other brokers in his firm.
At age 30, he became the youngest person to have bought a seat on the New York Stock Exchange and founded William O’Neil & Company, Inc. With this latter company O’Neil developed the first computerized database for daily securities in the early 1960s.
O’Neil continued to innovate throughout his career. He created Daily Graphs in 1972. This is a printed book of stock charts which continues to see weekly deliveries to subscribers. Then, in 1973, he founded O’Neil Data Systems, Inc. as a means of providing database publishing and printing services.
For the first time in 1984, O’Neil made his research available in print form to a broader public, as he launched Investor’s Daily. The national business paper has earned a spot alongside the Wall Street Journal and other major publications, although the name of the journal was changed in 1991 to Investor’s Business Daily.”
O’Neil explained that new highs were bullish. He observed that if a stock reached a new high at $60, it had also reached a new high at $59, at $58, at $57 and all the way back to the previous new high. This is, after he explained, obvious. New highs build on previous new highs.
This can be seen in the next chart where new highs are marked by green bars and the green bars cluster just as they did with the S&P 500. In this chart, Apple (Nasdaq: AAPL) is shown.
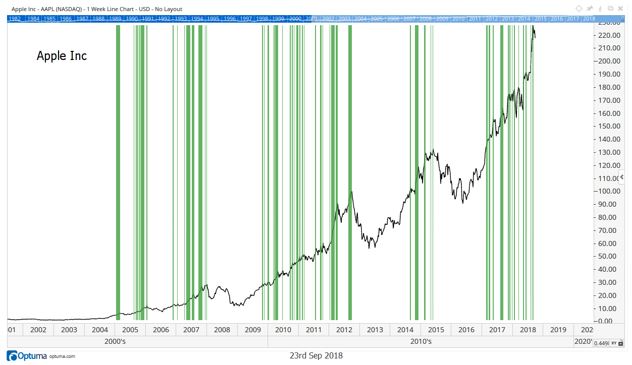
Source: Optuma
There are still some crashes but there are, more often, new highs after new highs.
Strength Is Often a Signal of Additional Strength
A trader who spent time with one of the world’s greatest traders recently explained the pattern shown in the charts above.
“Never short a new high or buy a new low. I learned that sitting in the trading room with Stevie Cohen at the old SAC Capital, although it is not something I recall him ever actually saying. The sentiment does, however, capture the sense of the room’s general outlook on trading. And, frankly, life…”
The logic around it looks something like this:
- Someone always knows more than you about a stock, a sector, or the market as a whole.
- If that “someone” decides to bid up a stock to a new high, you really don’t want to get in their way. It takes a LOT of conviction to keep buying even as a stock breaks out, so whoever is pushing it there feels they know something. Yes, they could be wrong (just look at FB’s new high right before last quarter’s horrible earnings). But they usually aren’t.
- That makes a breakout an important “Tell” and prudent risk management says you wait for the stock to stop making fresh highs before you short it.
- The same thing applies to new lows. Someone is selling that name even though it is cheaper than at any point in the last year. Wait for it to stop going down before buying. “Seller reloads” is a bad thing to hear when you are on the buy side of the trade.
This does explain exactly what O’Neil saw and what the price action shows. It takes buying to push prices up and institutions like hedge funds and pension funds tend to buy slowly. Steve Cohen, the great trader cited above, manages billions of dollars and needs to buy and sell over days.
This doesn’t mean there won’t be a market crash. It does mean there is a 77% chance of higher highs in the next six months. It does mean we should consider buying, rather than selling, in the current stock market.