This Sector Appears to Be on the Path to Recovery

Traders can find value in a top down investing style. This methodology, as its name implies, starts at the top and drills down.
The top is the major stock market averages. Here, many investors choose to keep their approach simple and they focus solely on the trend. They may just use a single moving average (MA), such as the 200 day MA. If prices are above the MA, the trend is up. Otherwise, the trend is down.
Right now, that analysis tells investors that the direction of the trend is up, and they should consider buying stocks.
The next step in a top down analysis is to consider sectors and industries. A sector is the broader category and the industry includes the more specialized companies. For example, within the capital goods sector are the home builders.
The chart below shows that the SPDR S&P Home Builders ETF (NYSE: XHB) is on a momentum buy signal.
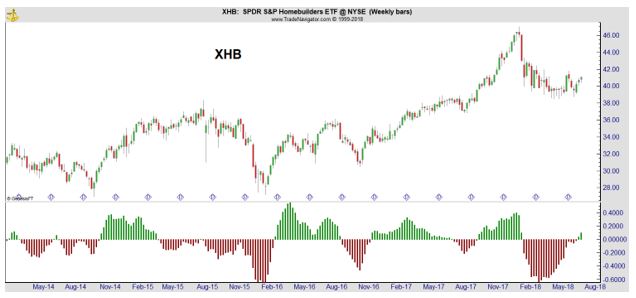
This is a weekly chart of the price action. Daily charts will offer more trading signals, but weekly charts could prove to be the most useful for individual traders who tend to be pressed for time and often won’t be able to take all of the signals on daily price charts.
At the bottom of the chart is the MACD indicator. This indicator is designed to measure momentum by measuring the distance between two moving averages of price. The indicator consists of several components and just one is shown in the chart.
The histogram in the chart offers a simple way to evaluate the status of the indicator. When it is above zero, it is bullish since momentum is positive. When it is below zero, momentum is falling and the indicator is bearish. In the chart, green shows a positive value of MACD and red represents a negative value.
Experts Confirm the Chart
Barron’s recently published a look at the home building industry and set the stage with a broad look at the fundamentals. That analysis noted,
“To profit from a potential correction in overvalued commercial real estate, BCA Research recommends a circuitous route: buy home-builder stocks and sell short real-estate investment trusts.
Ultra-cheap credit has inflated a bubble in CRE, according to BCA’s U.S. Equity Strategy’s special report. CRE debt hit a record for U.S. banks’ assets and dwarfs residential loans in terms of both growth and absolute levels, it adds. That makes CRE more vulnerable to rising interest rates given the excesses that are concentrated in this sector.
The bust in residential housing was a “once-in-a-lifetime crisis,” BCA argues. Unlike CRE–where overbuilding has resulted in problems for borrowers to service debt, portending increasing delinquencies, charge-offs and delinquencies–there’s a widely noted shortage of supply for new and existing homes for sale.”
With the industry now highlighted by the top down analysis, it is time to drill down to individual stocks to find potential buying opportunities.
Finding Value in Home Builders
One approach to stock selection is to use fundamental analysis. With this approach, an investor looks for stocks that offer the best value. When combined with the top down methodology, it means finding value in the selected industry to buy during a bull market in stocks.
The chart below compares some of the largest companies in the industry. The price to earnings (P/E) ratio is a popular valuation metric. The chart shows the P/E ratios based on both this year’s and next year’s expected earnings per share (EPS).
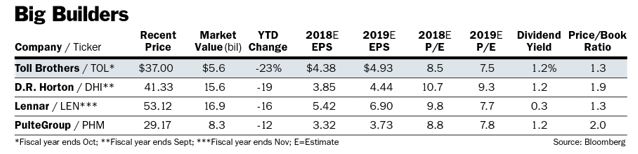
Source: Barron’s
The dividend yield and the price to book, or P/B, ratio are also shown for each stock. An investor can use just one or combine all three of these valuation tools in their decision. To keep this analysis simple, we will use only the projected P/E ratio.
In both years, the lowest P/E ratio belongs to Toll Brothers (NYSE: TOL).
“There is a disconnect between our business and the share price,” Toll CEO Douglas Yearley recently told Barron’s. “The stock was $52 in January, and it’s $37 today. Throughout that period of time, business has been good, and we’ve done a terrific job diversifying the company.”
At least some analysts agree with the CEO. In Barron’s, we learn:
“Toll has a high-quality land base and a good management team that has the ability to deploy capital through buybacks and other actions to improve returns,” says Michael Dahl, an analyst with RBC Capital Markets.
He maintains that the builder has a “compelling valuation” amid “intense negative sentiment” among many institutional investors. Dahl has an Outperform rating on the shares, with a $46 price target, 24% above its current quote.
Toll trades for 1.3 times its book value of $29 a share, a discount to most peers. Book could reach $35 by the end of the next fiscal year in October 2019, and it should be a floor under the stock, assuming that Toll remains solidly profitable.
Toll has sought to boost returns in part by holding less land on its balance sheet, helping to lift its return on equity to 15% from 9% in 2016.”
Management and analysts believe in the company. The chart of TOL is shown below.
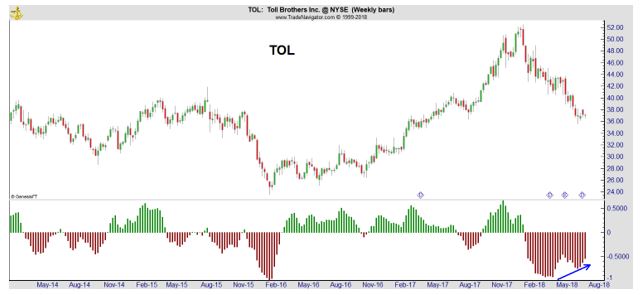
Again, MACD is shown and again the indicator is supporting a buy recommendation. In this chart, MACD remains negative but it is rising. The arrow highlights what technical analysts call a bullish divergence.
A divergence forms when prices and momentum move in opposite directions. Technicians expect momentum to lead price and they expect a divergence to be resolved in the direction of the momentum indicator.
When prices are down, and momentum fails to make a new low along with price, that is considered to be a bullish divergence. Since momentum leads price, this is looked at as a signal that the stock price is likely to reverse to the up side.
TOL is a buy, based on a top down analysis that moved from the broad stock market to individual stocks. This type of analysis could be useful since it can highlight ETFs that are attractive, like XHB, or individual stocks to consider, like TOL.
For other market tips and products, click here.