Stocks Are Overvalued: Here’s What That Really Means

Value investing is simple in theory. The general idea is to buy stocks that are undervalued. They are held and eventually sold when they become overvalued. That is certainly a simple theory. But, the implementation of that simple theory can be a problem.
First, the value investor must define value. Then, definitions of undervalued and overvalued are needed. This can, of course, all be done with precise formulas. However, precision can actually be little more than false comfort to value investors.
In the stock market, prices that seem to be undervalued can become more undervalued. Overvalued stocks and markets can become more overvalued. This is why it can be better to consider broad guidelines when developing a value investing framework.
Defining Value
The first problem of the value investor is to select a measure of value. There are many possibilities. One, for determining the value of the stock market is the Shiller CAPE ratio.
This metric is the cyclically adjusted price-earnings (or CAPE) ratio developed by Nobel Prize winning economist Robert Shiller. It compares current prices to average earnings over the past 10 years adjusted for inflation. It’s intended to measure earnings over the course of an entire business cycle.
The current reading of the CAPE and its history back to the 1800’s is shown below.
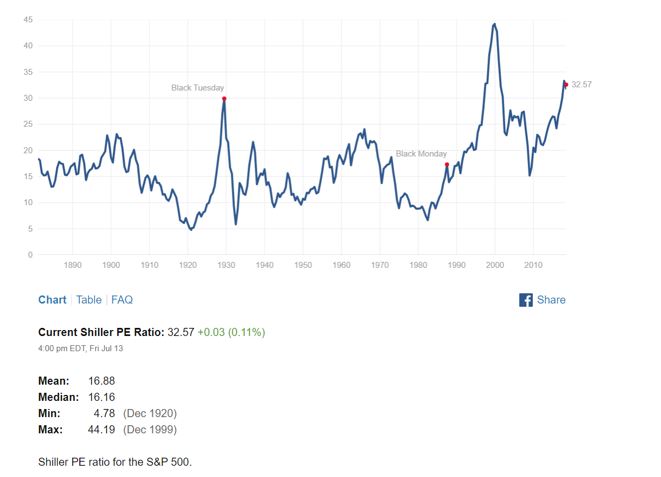
Source: multpl.com
It’s important to note that the CAPE ratio can also be applied to individual stocks. That is actually the measure of value that Ben Graham, Warren Buffett’s business school professor, advocated using in his book, The Intelligent Investor.
Graham thought it was important to consider earnings of a company over an entire business cycle, a thought process that is similar to the logic underlying Shiller’s model for the stock market as a whole.
From the chart above, we can see that this metric indicates the stock market is overvalued.
But, a less inclusive look, the P/E ratio using just one year’s worth of earnings, is not quite as overvalued.
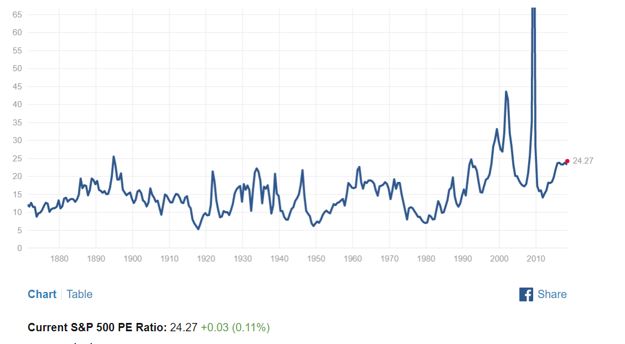
Source: multpl.com
This illustrates one of the problems a value investor faces. The different measures of value can provide conflicting information.
Why Valuation Matters
Valuation measures are important because they are a significant component of market returns. One analyst notes, “the trend in P/Es is the most significant determinant of stock market returns.
There are only three sources of returns from the stock market: earnings growth, dividend yield, and the change in P/E (the overall level of valuation in the market). To illustrate the impact of the P/E cycle, we can assess stock market returns over the past century by breaking the long-term into relevant periods for most investors—decades rather than centuries.
Since 1900, there have been 97 ten-year periods (i.e. 1900-1909, 1901-1910, etc.). As most investors know, the average long-term return from the stock market has been 10%; and that is the average of all 97 decade-long periods.
It is striking, however, that average rarely happens. None of the 97 periods were exactly 10%—all were either above-average or below-average. So the only wrong answer for investors is to assume the long-term average.
A wiser choice is to decide that it is more likely from today either to be an above-average decade or one that will be below-average. For insights into which is more likely, we can [consider] the three components of stock market return: earnings growth, dividend yield, and the change in P/E.
Figure 4 is enlightening: our hero, the P/E, is the major driver of whether returns are above or below average. The generally more stable combination of earnings growth (blue) and dividend yield (brown) is pulled in both directions by the trend in P/E.
When the P/E was trending upward, the green-shaded addition to the bars provides above average returns; whereas, when the P/E was trending downward, the red-shaded pull mutes returns into a below-average result.”
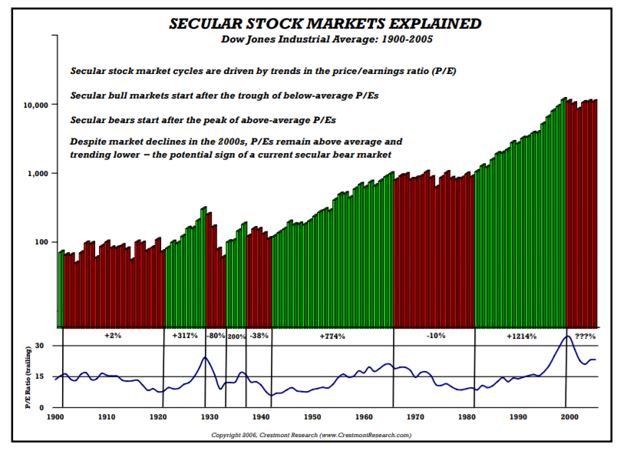
Source: Crestmont Research
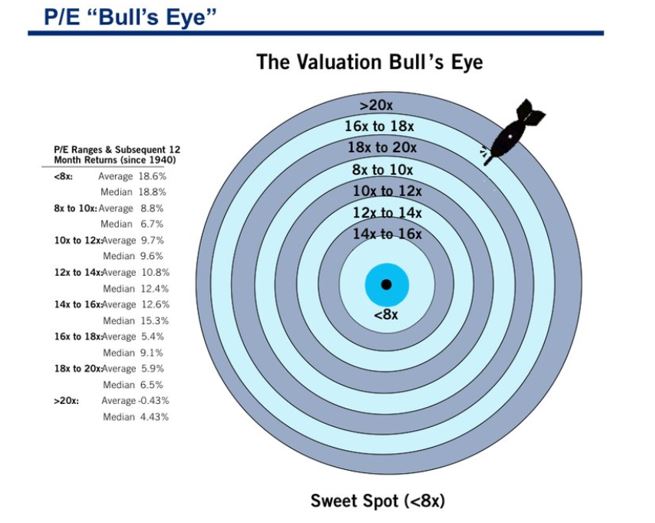
This means that value matters in the long run. And long-term gains are likelier when the P/E ratio is low than when it is high. The next chart illustrates this relationship.
![]()
Source: Business Insider
Notice that with the P/E ratio currently above 20, the stock market is likely to deliver below average returns. But, the chart also shows that high returns are also possible.
The chart above shows both an average and a median value for returns. The average is a calculation many investors are familiar with. It is found by summing the individual returns and dividing by the number of returns in the sample.
The median is the middle value. If there are eleven values, for example, the median is the sixth value when they are ranked from high to low. There are five values above that level and five that lie below the median value in this case.
Notice in the chart above that when the P/E ratio is above 20, the average return is negative while the median value is positive, at 4.43%. This indicates the average is skewed by at least one very negative value that is bringing the average significantly below the median value.
That is an important insight for value investors to keep in mind. It is also important that no individual year is likely to be average. In fact, every year is likely to be either above average or below average.
In a market such as this one, where the valuation metrics of the market and of many individual stocks are higher than average, selectivity becomes key. In the words of some traders, this is a market of stocks rather than a stock market.
There are values in the market, but they will require research. There could be more value among smaller cap stocks because smaller stocks are generally less widely followed than large cap stocks. Investors can benefit from, in effect, where few other investors are looking.
However, investors should be cautious about becoming too defensive in this environment. As the average value in the final chart above shows, there are at least some years when significant returns occur even when the stock market is at an overvalued extreme.
For other market related tips and products, click here.